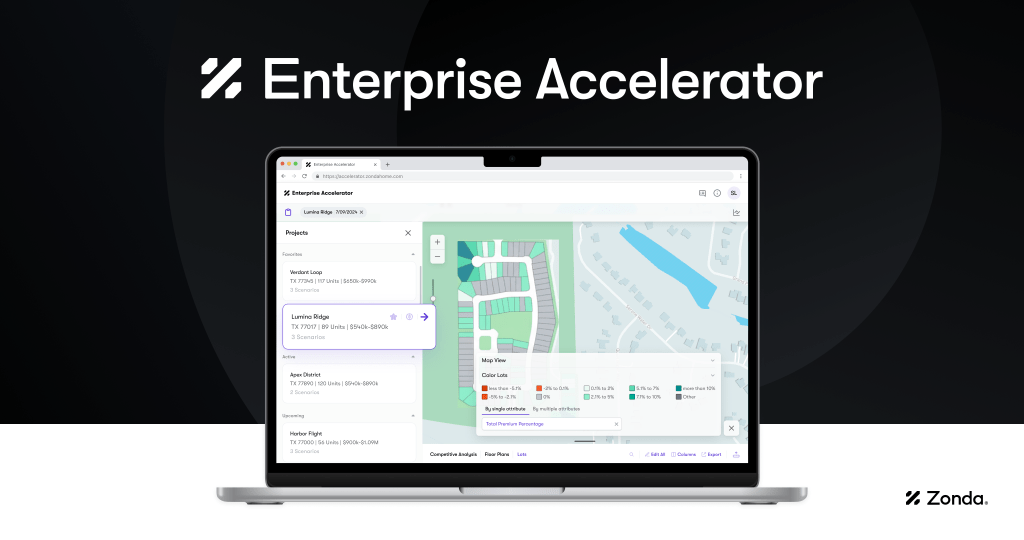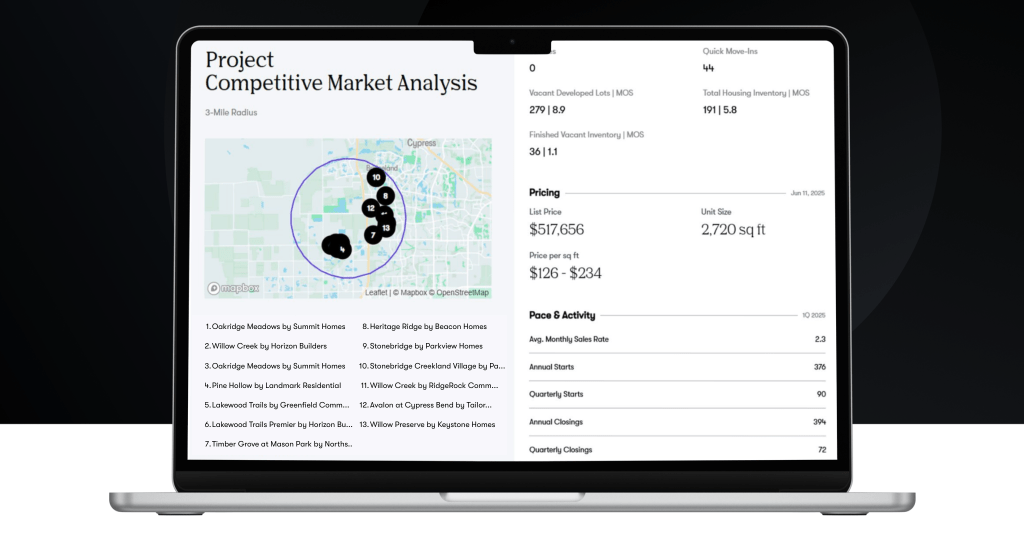
Competitive Market Analysis (CMA)
The new CMA workflow empowers you to build a complete market analysis in just a few clicks. With customizable project lists, detailed performance metrics, and visual graphs, you can clearly define how your project should be positioned.
Key capabilities include:
- Select up to 25 active new home projects for analysis
- Generate interactive Price vs. Unit Size and Price vs. Sales Rate graphs
- Include deed-level resale comps for a complete picture of new vs. existing home price differences
- Access important performance metrics like sales rates, VDLs, inventory, pricing history, incentives, HOA fees, tax rates, and more
- Export presentation-ready PDF and XLSX reports instantly
Whether you’re preparing for land acquisition, assessing peer performance, or adjusting pricing strategy, CMA helps you make faster, more informed decisions.
Subdivision Section Filtering

Focus on the specific segments that matter. Enterprise now allows users to filter and view activity at the section level within subdivisions including lot width, builder, price range, and product type.
This tool unlocks powerful use cases such as:
- Easily track specific-sized lot inventory within a CBSA
- Analyze builder performance by section within a master-planned community
- Drill into annual starts and closings for a competitor’s specific product in a specific price range
All section-level filters integrate seamlessly with standard Builder Activity, Inventory, and Price History reports.
School Attendance Zone Geography
Filter and view data using school attendance zones as a geography layer—unlocking powerful use cases tied to demographic and housing characteristics, existing housing and future supply; and housing value differences between attendance zones.
Use it to:
- Evaluate development potential near high-performing schools
- Compare pricing and inventory across different school zones
- Support decisions around new school sites or retail development
Project Data Summaries

Customize project-level reporting like never before. Generate detailed summaries on:
- Price Segmentation
- Lot Segmentation
- Builder benchmark performance
Summaries reflect your selected filters and geography—helping you quickly answer questions like:
“How many move-in-ready homes are priced $350K–$450K in this school district?”
“Who are the top builders in my market for 40′ lots?”
Rent vs Buy: BTR Comparable Sales Rate

A new Build-to-Rent vs. For-Sale comparison helps you understand purchasing power tradeoffs based on rent payments at BTR projects vs for-sale price points. Enterprise with Build-to-Rent customers can easily analyze the comparable Build-to-rent project rental rate to a monthly payment of a traditional home loan (inclusive of mortgage, taxes, and HOA).
Use this feature to:
- Understand what renters in your market could afford to buy
- Position for-sale product against BTR competition
- Guide pricing, design, and marketing strategy
Expanded Segmentation Fields
Access 12 new data variables to both price and lot segmentation exports, including:
- Annual starts and closings
- Finished vacant inventory
- Under construction inventory
- Months of supply by segment
- Reconciled totals and N/A indicators
Enjoy a single, detailed view across pricing and product types—supporting decisions in land acquisition, entitlement, product development, plan mix optimization, and more.
Census-Aligned Geography Update
Enterprise now reflects the latest U.S. Census Bureau definitions for Core-Based Statistical Areas (CBSAs) and county boundaries. This ensures your geographies align with the most accurate and current standards for reporting and market tracking. See the full list of updated definitions.
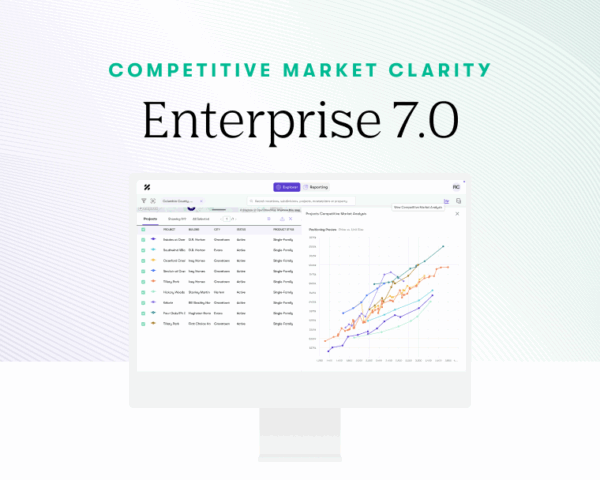
Enterprise 7.0 is live now. Log in to start using the new features or connect with your Customer Success Manager for a personalized walkthrough. Not yet a Zonda Enterprise subscriber? See how Enterprise can help you stay competitive.