
Enterprise
Homebuilding data at your fingertips
Zonda Enterprise turns homebuilding data into actionable strategy with the industry’s most comprehensive data platform.
Track the full new home construction lifecycle and unlock powerful insights through clear visuals, smart analytics on a map, and advanced segmentation, all in one easy-to-use platform.

Track the entire construction lifecycle
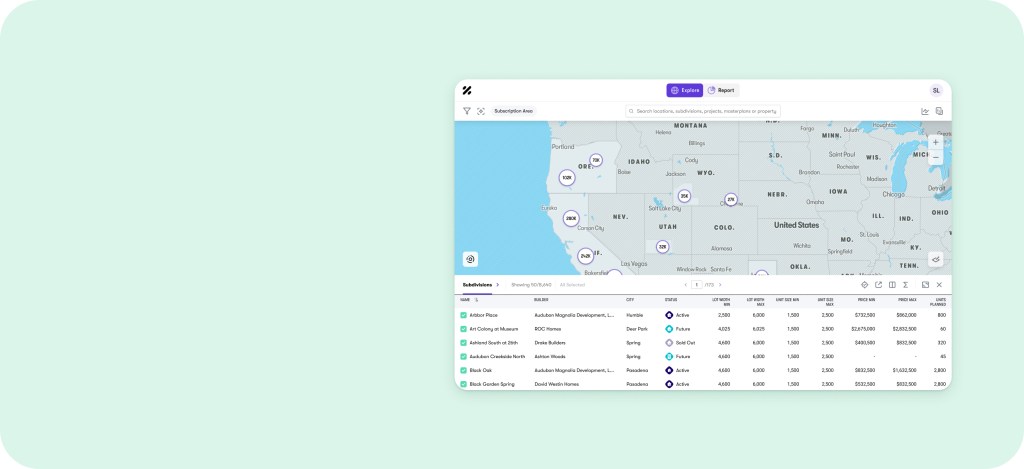
Monitor land status, new and existing home inventory, sales performance, and future supply, all updated daily.
Create your own market views
Define geographies by state, zip code, subdivision, or simply draw your own coverage area on a map.
Drill down to uncover insights
Slice and analyze the data by product type, lot size, and pricing to reveal insights that drive smarter decisions.
New! See what’s in the latest release.
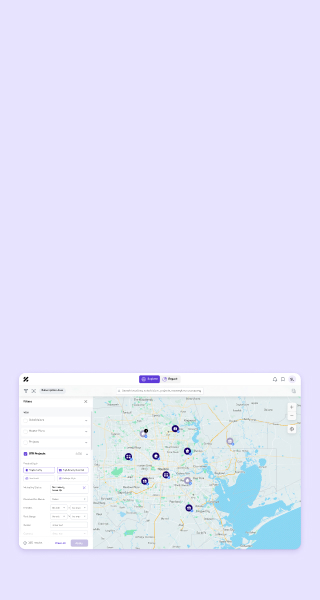
June 2026: Easy-to-read map clusters for the iPad Enterprise app
- Clearer visual presentation: When you’ve got a map with a lot of markers in a small area (like several new home developments in a small area), it can get cluttered and confusing to read everything. A map cluster groups nearby markers into a single visual with counts and distribution. It makes it much cleaner to look at a map, especially when you’re zoomed out.
- Easier exploration of maps: It’s simpler than ever to sift through the tremendous amount of data that’s in Enterprise. You can get a clearer view of activity within an area without losing the specificity and detail you need, while still seeing the bigger picture.
All your housing data in one place
Access Zonda’s proprietary land, new home, and project data through one modern, centralized platform. Stay current with daily updates, explore historical and timely insights, and track active and future supply to make informed, data-driven decisions.

Build smarter with Zonda Enterprise
Turn complex market data into clear, actionable insights. With more than 500 housing metrics available, Zonda Enterprise provides timely visibility into supply, demand, pricing, and competition, so you can plan communities, set strategy, and stay ahead of the market.
Build smarter with Zonda Enterprise
Turn complex market data into clear, actionable insights. Zonda Enterprise gives builders real-time visibility into supply, demand, pricing, and competition, so you can plan communities, set strategy, and stay ahead of the market.

New! Enterprise Accelerator
Zonda Enterprise Accelerator gives you a powerful AI-backed engine for modeling different pricing scenarios for your homes.
Use current market data to model inventory, build unique pricing scenarios, and move homes with confidence. No spreadsheets required.

New! Zonda Enterprise Accelerator
Zonda Enterprise Accelerator gives you a powerful AI-backed engine for modeling different pricing scenarios for your homes.
Use current market data to model inventory, build unique pricing scenarios, and move homes with confidence. No spreadsheets required.
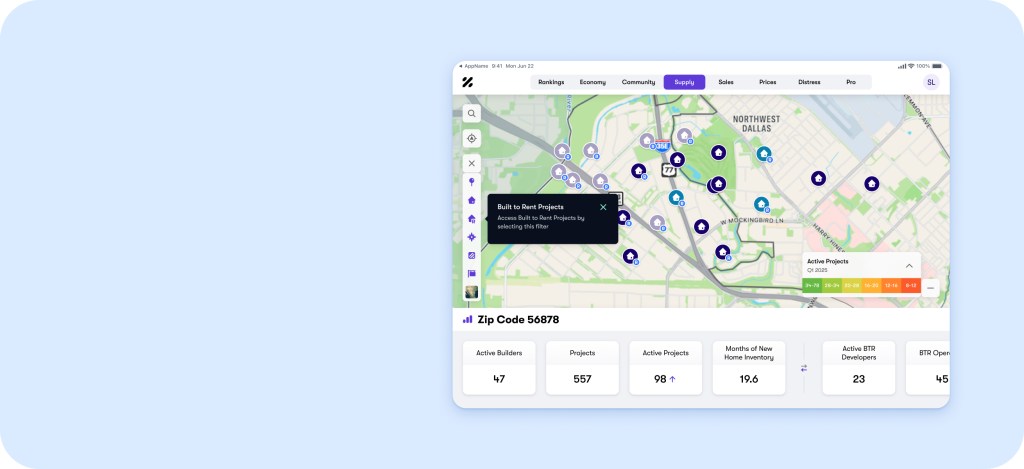
Enterprise for iPad
Enterprise for iPad puts Zonda’s housing intelligence at your fingertips, letting you drop pins, scan markets, and generate site reports instantly, built for speed and mobility in the field. Stay on top of pricing shifts, comps, and insights wherever the job takes you.
Enterprise for iPad
Enterprise for iPad puts Zonda’s housing intelligence at your fingertips, letting you drop pins, scan markets, and generate site reports instantly, built for speed and mobility in the field. Stay on top of pricing shifts, comps, and insights wherever the job takes you.
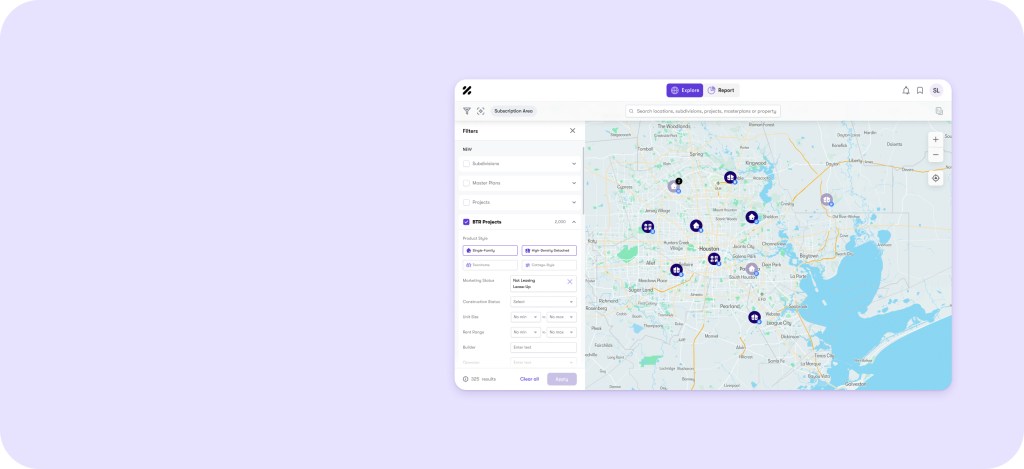
Enterprise with Build-to-Rent
The most complete build-to-rent data in the industry, with more than 2.7K BTR projects available. Track build-to-rent communities from planning to completion with full visibility into timelines, product types, and developer activity.
Enterprise with Build-to-Rent
Track build-to-rent communities from planning to completion with full visibility into timelines, product types, and developer activity.

MortgagePro
Effectively target homebuilders and realtors, identify top loan officers for recruiting, benchmark against competitors, and grow market share.
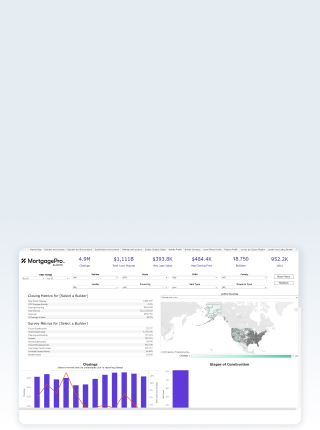
MortgagePro
Effectively target homebuilders and loan originators within the new construction market.
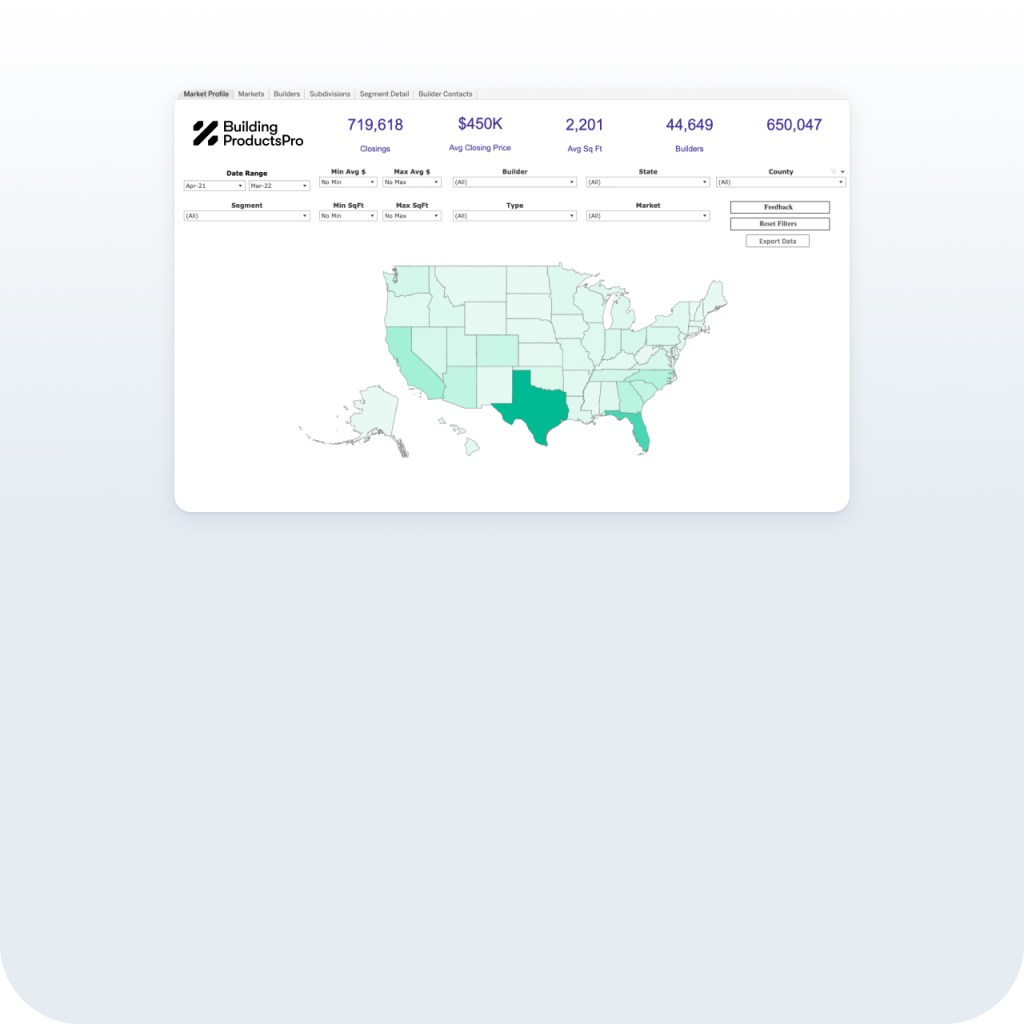
BuildingProductPro
Quickly target homebuilders and subdivisions best suited for your product offerings.
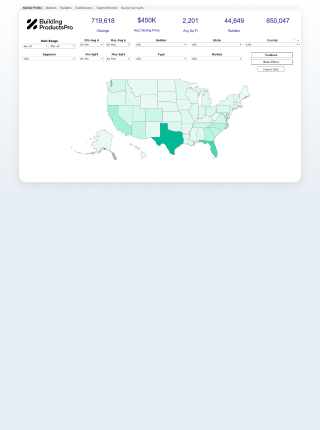
BuildingProductsPro
Quickly target homebuilders and subdivisions best suited for your product offerings.
Build smarter with Zonda Enterprise
Turn complex market data into clear, actionable insights. Zonda Enterprise gives builders real-time visibility into supply, demand, pricing, and competition, so you can plan communities, set strategy, and stay ahead of the market.

Get certified in Zonda Enterprise
The new Zonda Enterprise Training Certification Program is a structured, self-paced learning experience designed to create confident users across your organization.
Participants progress through a series of modules combining short video instruction with interactive quizzes, culminating in a final assessment and verifiable certification that can be shared on LinkedIn.
500+
housing metrics tracked
54K+
active & future subdivisions
1K+
active & future master plans