Housing Market

Zonda newsfeed: the new year starts with some momentum

Jan 19, 2020

We spent much of 2019 holding our breath, not sure whether we should believe that the rebound in the economy from the second half of 2018 was real. Heading into the new year, 2020 started with some momentum thanks, in part, to three rate cuts from the Federal Reserve in 2019. The risks of an imminent recession are easing, driven by factors such as the phase one trade deal between the US and China signed earlier this week, the once inverted yield curve is back to being positively sloped (though not overly steep), and housing demand is showing resilience. These changes are bolstering equity markets and driving up confidence. As we learned with the conflict with Iran earlier this month, however, political and geopolitical risks are the hardest to predict and could turn the direction of the economy almost overnight.

December Jobs Number Caps Another Year Of Growth

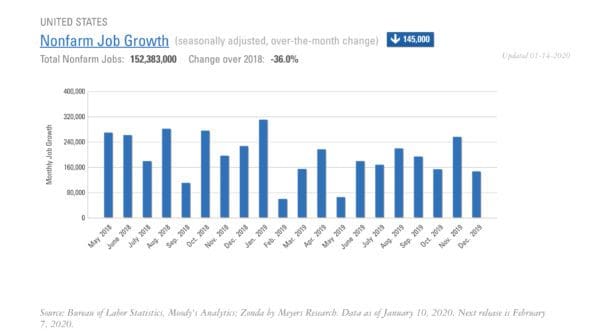
Nonfarm payrolls have increased for 111 consecutive months, the longest stretch on record.

  • Education and healthcare grew faster than any other sector volume-wise in 2019, adding 650,000 jobs. Manufacturing, an industry caught in the crossfire of the trade war, experienced tepid job growth last year. The sector added only 46,000 jobs this year after totaling 264,000 in 2018.
  • In 2019, job growth averaged 176,000 per month, down from 223,000 the previous year. In total, the year finished with just over 2.1M nonfarm jobs added, the lowest yearly figure since 2011. Slowing job growth is expected, though, with the economy operating at/near full employment.
  • Raleigh, Jacksonville, and Dallas are leading top metros with the most job growth year-over-year, averaging between a 3.0% and 4.0% annual clip.

United-States-Nonfarm-Job-Growth-600x332

Home Price Appreciation Picks Back Up

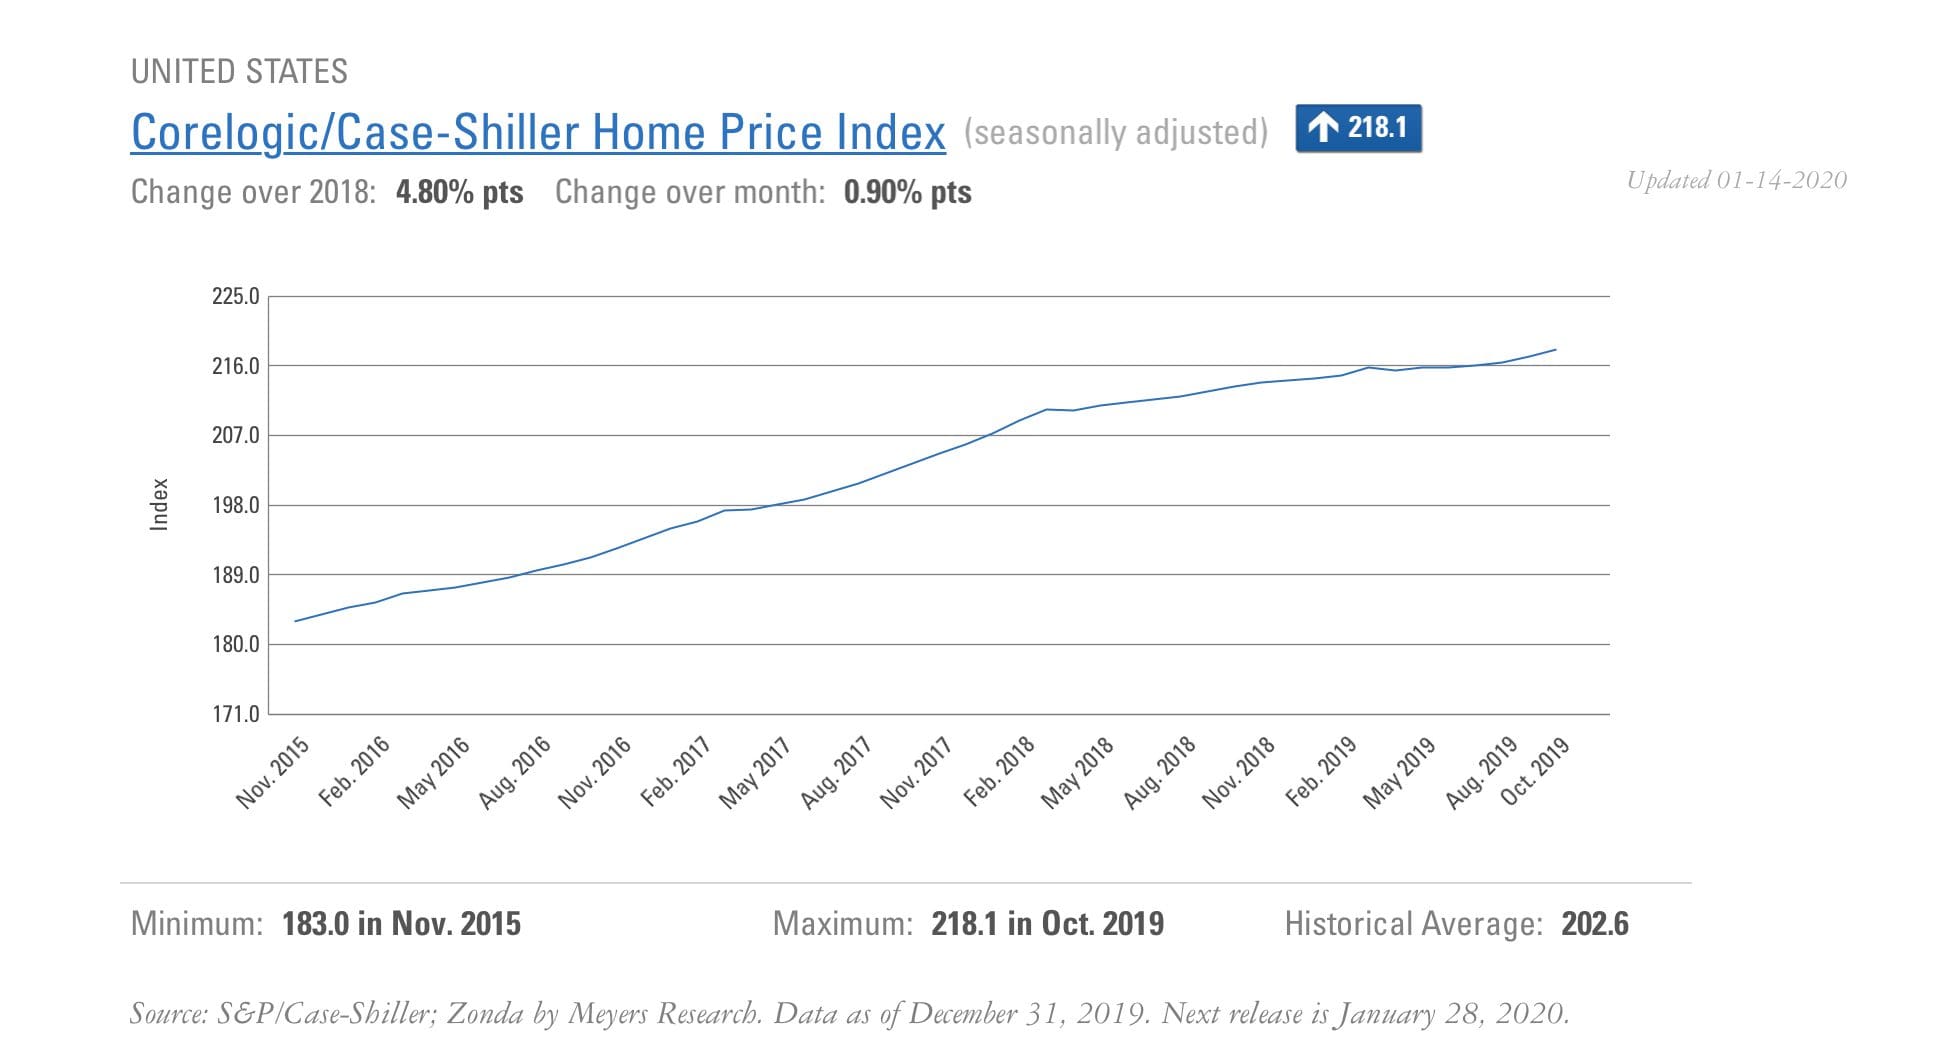
The Case-Shiller National Index increased 3.3% year-over-year. 

  • Wage growth (2.9% YOY) and home price appreciation (3.3% YOY) are moving closer in-line today than in the past, but the latter picked up sooner and quicker than the former this cycle, contributing to today’s affordability challenges.
  • The 20-City Composite Index decelerated over the past 12 months but is now growing 2.2% compared to last year, a third consecutive month of re-acceleration. The 20-City Composite has posted 90 straight months of positive year-over-year increases.
  • Phoenix, Tampa, and Charlotte reported the largest gains compared to the year prior. A year ago, the markets with the most significant price appreciation were Las Vegas, San Francisco, and Phoenix. 
United States CorelogicCase-Shiller Home Price Index

New Home Buyers Are Making The Market Work For Them

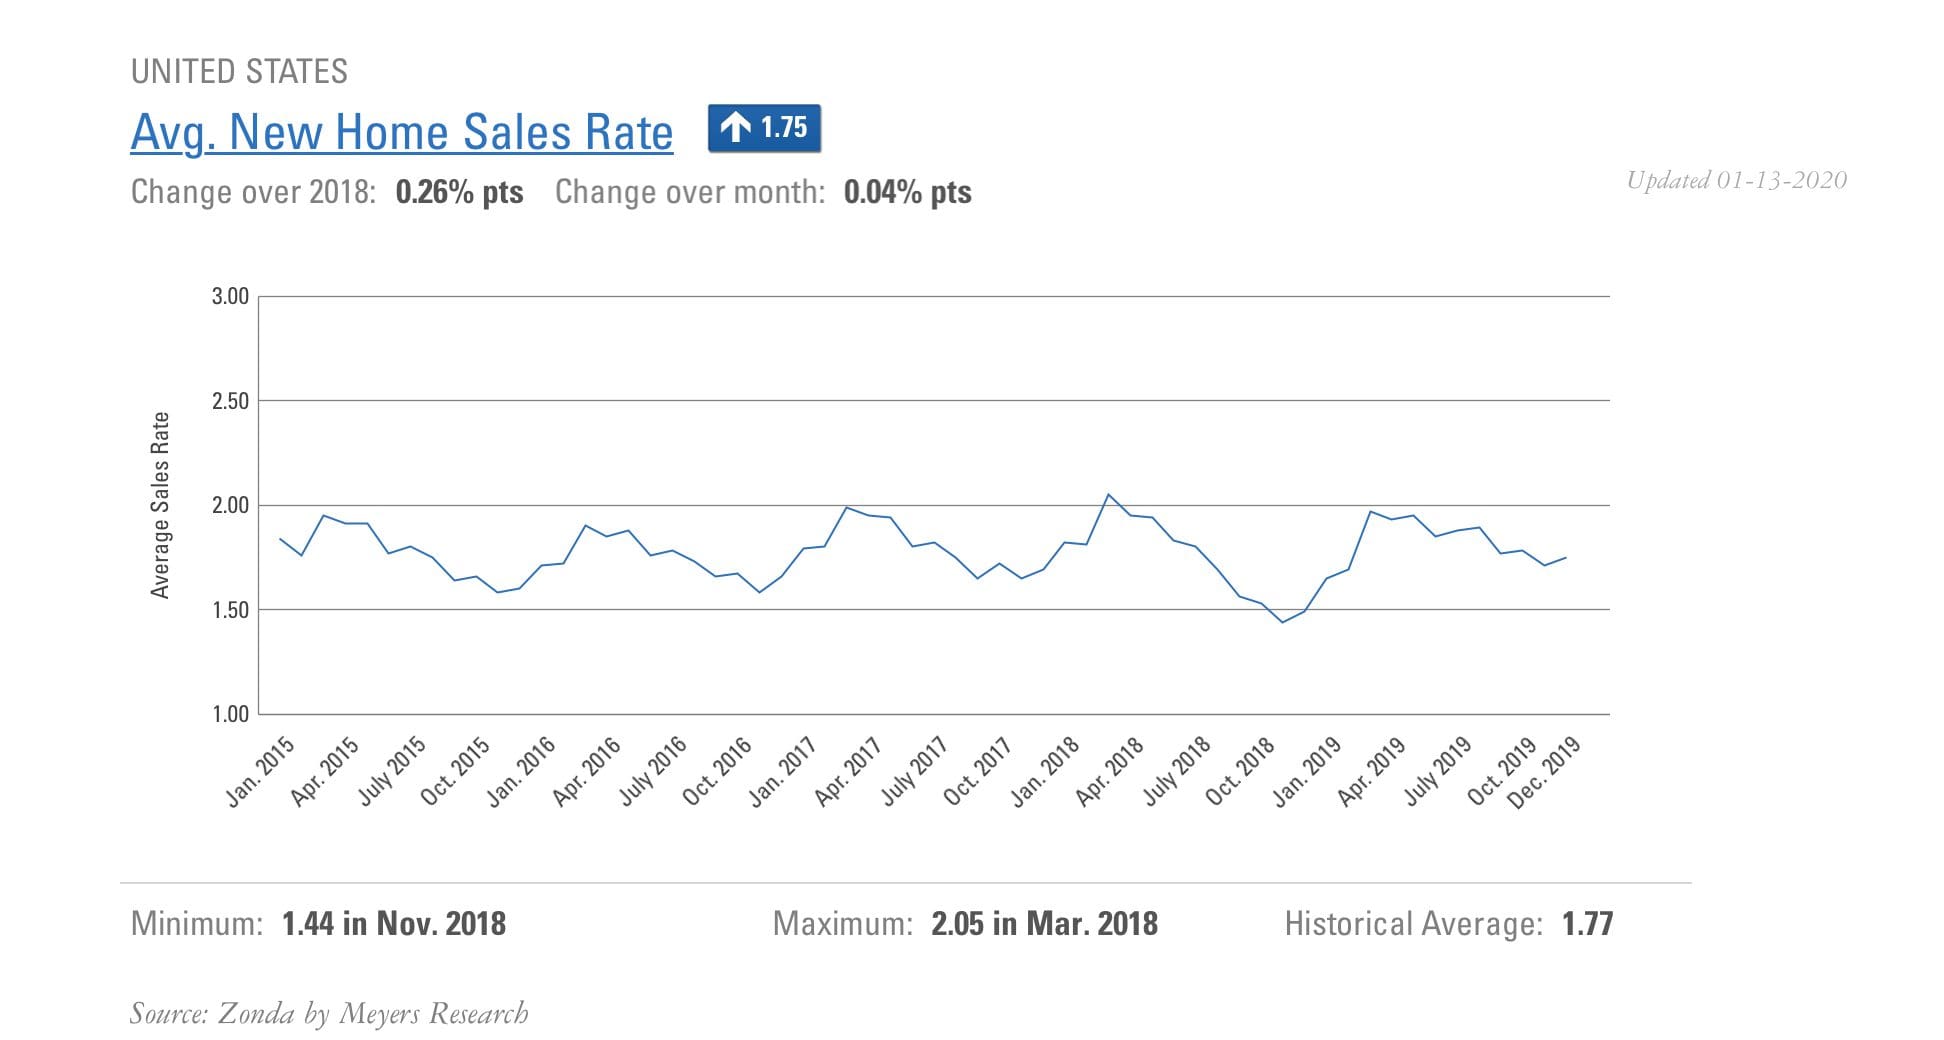
Given the easy comps for home sales in the second half of 2018, the two-year change is as important as the year-over-year figures. Both show strength in the housing market.

  • The average new home sales rate per community increased to 1.75 in December 2019, up 17.4% year-over-year and 3.6% compared to two years ago. In fact, December’s average sales rate per community was the highest for that month since Zonda’s inception.
  • Our New Home Pending Sales Index (PSI), a leading indicator of closings that considers sales, supply, and seasonality, grew 1.4% month-over-month and 14.3% year-over-year. The index is up 5.0% on a two-year basis.
  • Los Angeles, Seattle, and Riverside led our New Home PSI for year-over-year growth but are flat or down on the two-year view. Columbus, Phoenix, and Austin are the strongest compared to the same time in 2017.
United States Avg. New Home Sales Rate
How can Zonda's real-time data help you?

Ali Wolf

Chief Economist

Ali Wolf

Chief Economist

Recent news