New Home Market Update
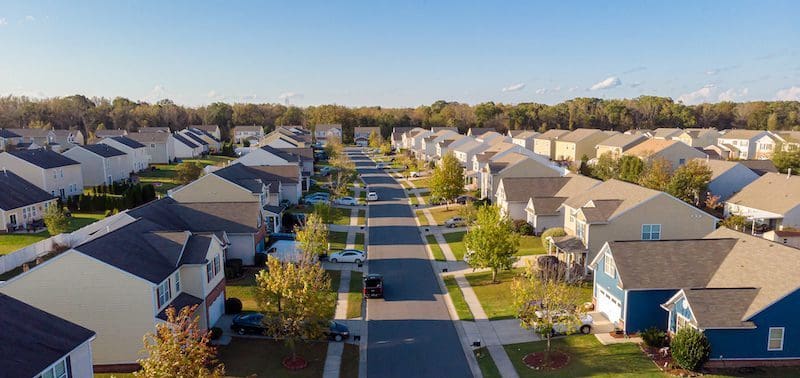
New home pending sales posted a monthly gain to end the year. Home sales are down 39.9% year-over-year but saw a slight rise as builders increased incentives and price cuts.
Zonda’s New Home Pending Sales Index for December captured that sales were down 39.9% compared to the year prior but posted a 2.7% month-over-month increase. The increase corresponded with a 7.5% month-over-month reduction in quick move-in inventory as builders offered incentives and price cuts to help sell any standing or soon-to-be-available homes.
Mortgage rates, while roughly double from where they started last year, have averaged below 7% for 10 straight weeks and are currently sitting around 6%. Rates in the low 6%s allow for expensive but effective mortgage buydowns that help with both housing affordability and consumer confidence regarding the purchase
“The leveling off of financing costs combined with builders ‘ripping the band-aid off’ regarding home prices and normal sseasonality has allowed for green shoots in the housing market to start 2023,” said Ali Wolf, Zonda’s Chief Economist. “Price discovery is happening quickly in the new home market and housing demand in many metros across the country is showing signs of either stabilizing or improving compared to the second half of last year.”
While the green shoots are encouraging, the team at Zonda is still closely monitoring the risks related to changes in policy, the direction of the economy, housing affordability, and shifts in consumer confidence.
Zonda’s new home sales metric counts the number of new home contract sales each month and accounts for both cancellations and seasonality. This metric shows there were 424,535 new homes sold in December on a seasonally adjusted annualized rate. This was a decline of 19.6% from last month and a drop of 44.0% from a year ago. On a non-seasonally adjusted basis, 30,633 homes were sold, 47.0% lower than last year and 36.6% below the same month in 2019. Note: this data is subject to revisions and will likely be revised higher next month.
Total volume is down due to both supply and demand. Zonda’s New Home Pending Sales Index (PSI) was created to help account for fluctuations in supply by combining both total sales volume with the average sales rate per month per community. The December PSI came in at 95.3, representing a 39.9% decline from the same month last year. The index is currently 45.3% below cycle highs. On a month-over-month basis, seasonally adjusted new home sales increased 2.7%.
National home prices increased year-over-year across entry-level, move-up, and high-end homes. Prices rose 9.6% for entry-level to $337,282, 8.9% for move-up to $526,445, and 7.7% for high-end homes to $902,905.
Supplementing our data with a monthly survey Zonda conducts, there were roughly 43% of homebuilders across the country that reported lowering prices month-over-month in December.
The table below shows the top three markets for year-over-year home price change in each tier.
The large increase in New York is reflective of mix shift as some communities have sold out and some have opened compared to last year.
Incentives are increasingly common in today’s housing market given the slower sales. 57.2% of active projects are offering to-be-built incentives, up from last month. The average incentive dollar amount is $13,336 or 3.9% of the list price.
There are currently 13,463 actively selling communities tracked by Zonda, down 7.2% from last year. On a month-over-month basis, the national figure slipped 2.1%. Total community count is 29.6% below the same month in 2019. Zonda defines a community as anywhere where 5 or more units are for sale.
National quick move-ins (QMIs) totaled 31,509, up 173.0% compared to last year but 7.5% lower month-over-month. The month-over-month drop in QMIs is reflective of builders offering price cuts and incentives to help move the inventory. Total QMIs are 47.9% above 2019 levels. QMIs are homes that can likely be occupied within 90 days.
The Zonda New Home Pending Sales Index (PSI) is built on proprietary, industry-leading data that covers 60% of the production new home market across the United States. The reported number of new home pending contracts are gathered and analyzed each month. Released on the 15th business day of each month, the New Home PSI is a leading indicator of housing demand compared to closings because it is based on the number of signed contracts at a new home community. Zonda monitors 18,000 active communities in the country and the homes tracked can be in any stage of construction.
The new home market represents roughly 10% of all transactions, allowing little movements in supply to cause outsized swings in market activity. As a result, the New Home PSI blends the cumulative sales of activity recently sold out projects with the average sales rate per community, which adjusts for fluctuations in supply. Furthermore, the New Home PSI is seasonally adjusted based on each markets’ specific seasonality, removes outliers, and uses June 2016 as the base month. The foundation of the index is a monthly survey conducted by Zonda. It is necessary to monitor both new and existing home sales to establish an accurate picture of the relative health of the residential real estate market.
Zonda provides data-driven housing market solutions to the homebuilding and multifamily industries. From builders to building product manufacturers, mortgage clients, and multifamily executives, we work hand-in-hand with our customers to streamline access to housing data to empower smarter decisions. As a leading brand in residential construction, our mission is to advance the home building industry, because we believe better homes mean better lives and stronger communities. Together, we are building the future of housing.
Stay in the know with Zonda updates direct to your inbox. Subscribe today to receive webinar information, economics reports, podcast episodes, and more!