New Home Market Update
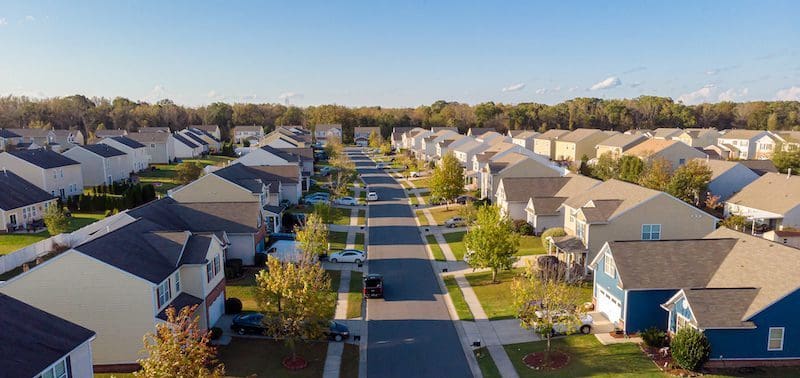
New home sales increased in August but continue to decline year-over-year, down 26.1%. This report showcases the latest housing trends in the new home market for August.
August saw a slight increase in new home sales, but the housing market is cooler compared to last year. Zonda’s New Home Pending Sales Index (PSI) captured a 3.2% month-over-month increase in contract sales in August. This aligns with the trends seen in mortgage rates for the month; the average mortgage rate in August of 5.22% was at the lowest since April of this year. Looking at the market relative to last year, total contracts are down 25.1% year-over-year, and the average sales rate is off 26.1%. Nationally, sales are down 7.8% compared to August 2019 levels, led by the more notable slowdowns in the West and Mountain West regions.
As we look at September trends, mortgage interest rates have risen to the highest level since 2008, following the highest yield on the 10-year Treasury since 2011. The volatility in the mortgage market combined with negative housing headlines, battered consumer confidence, and higher monthly housing costs suggest that the slower sales environment will likely continue throughout the balance of the year.
“The buyer backdrop in the housing market today is complicated,” said Ali Wolf, Zonda’s chief economist. “We know that some housing demand was pulled forward over the past year driven by pandemic lifestyle changes and the abrupt drop in mortgage rates. Investor activity, second home buyers, and purchases by some higher wealth individuals are good examples. We also know that some buyers were unable to be competitive enough over the past couple of years to secure a home and they remain pent-up demand waiting on the sidelines. This is the group we should focus on.”
The New Home Pending Sales Index, a leading residential real estate indicator based on the number of new home sales contracts signed across the country, came in at 107.9, representing a 25.0% decline from the same month last year. The index is currently 38.1% below cycle highs. On a month-over-month basis, seasonally adjusted new home sales increased 3.2%.
National home prices increased year-over-year across entry-level, move-up, and high-end homes. Prices rose 13.9% for entry-level to $340,171, 11.2% for move-up to $527,874, and 7.0% for high-end homes to $896,549. The rate of home price growth flattened across all three price tiers in August.
The table below shows the top three markets for year-over-year home price change in each tier.
72% of builders reported increasing incentives month-over-month. Incentives are becoming increasingly prevalent in today’s housing market as consumer hesitancy slows overall purchase activity. Funds towards closing costs, mortgage rate buydowns, and discounts on options and upgrades are some of the most common types of incentives.
Community count looks at any project that has five or more units for sale. There are currently 13,193 actively selling communities tracked by Zonda, down 10.2% from last year. On a month-over-month basis, the national figure slipped 1.4%. Total community count is 31.3% below the same month in 2019.
National quick move-ins (QMIs) totaled 23,439, up 98.1% compared to last year and 7.5% higher month-over-month. Total QMIs are 5.3% above 2019 levels. QMIs represent homes that can be occupied within 90 days and become important to watch as the market shifts.
The Zonda New Home Pending Sales Index (PSI) is built on proprietary, industry-leading data that covers 60% of the production new home market across the United States. The reported number of new home pending contracts are gathered and analyzed each month. Released on the 15th business day of each month, the New Home PSI is a leading indicator of housing demand compared to closings because it is based on the number of signed contracts at a new home community. Zonda monitors 18,000 active communities in the country and the homes tracked can be in any stage of construction.
The new home market represents roughly 10% of all transactions, allowing little movements in supply to cause outsized swings in market activity. As a result, the New Home PSI blends the cumulative sales of activity recently sold out projects with the average sales rate per community, which adjusts for fluctuations in supply. Furthermore, the New Home PSI is seasonally adjusted based on each markets’ specific seasonality, removes outliers, and uses June 2016 as the base month. The foundation of the index is a monthly survey conducted by Zonda. It is necessary to monitor both new and existing home sales to establish an accurate picture of the relative health of the residential real estate market.
Zonda provides data-driven housing market solutions to the homebuilding and multifamily industries. From builders to building product manufacturers, mortgage clients, and multifamily executives, we work hand-in-hand with our customers to streamline access to housing data to empower smarter decisions. As a leading brand in residential construction, our mission is to advance the home building industry, because we believe better homes mean better lives and stronger communities. Together, we are building the future of housing.
Stay in the know with Zonda updates direct to your inbox. Subscribe today to receive webinar information, economics reports, podcast episodes, and more!