New Home Market Update
Valerie Sheets
vsheets@zondahome.com
949-294-9557
The New Home Lot Supply Index (LSI) for the fourth quarter is up both month-over-month and year-over-year. While the lot market nationally remains “significantly undersupplied,” the latest index value is back to late-2020/early-2021 levels.
The New Home LSI, backed by data from Zonda, shows lot supply loosened year-over-year across the United States. The index is a residential real estate indicator based on the number of single-family vacant developed lots and the rate at which those lots are absorbed.
“The increase in the index captures some of the healing going on in the residential housing market,” said Ali Wolf, chief economist at Zonda. “With both sales and starts lower than the frenzied pace seen over the past few years, there are early signs that availability for lots, materials, and labor are improving. More importantly, costs in these three categories are flattening in some cases and coming down in others in response to the slower market.”
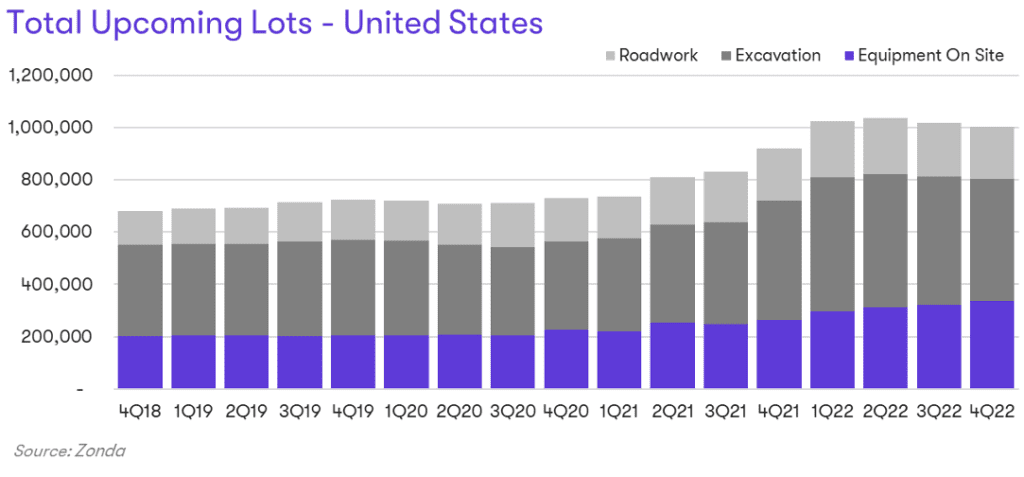
Zonda also records future lots through the stages of development. The stages range from raw land through streets in, which is the last step before the lot becomes a vacant developed lot. Zonda groups the last few stages into a classification called total upcoming lots, which typically indicates delivery over the next 12-18 months.
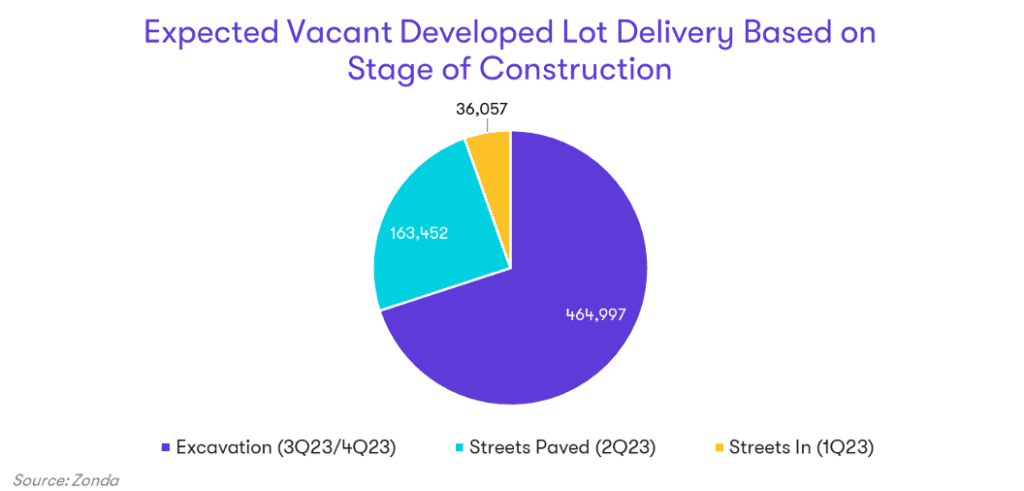
Total upcoming lots for 4Q22 increased 9% year-over-year but fell 1% from last quarter. The largest annual gains among the total upcoming lots came in the equipment on site stage, which grew 28% from the same period last year. The largest share of total upcoming lots are in the excavation stage, making up 70% nationally and have an expected delivery between 3Q23 and 4Q23 (the range represents different timeframes from local entitlement processes). Note, not all the lots in excavation will match Zonda’s estimated timeline.
“The spring selling season holds the keys to how the market progresses from here,” said Wolf. “An early read shows consumer activity is picking up again and if that trend continues, we could see stronger-than-expected starts this year. As it stands, though, the majority of homebuilders expect that housing starts will finish 2023 below 2022 levels.”
Get more granular custom housing market data based on your region and your business needs. Learn more about our Advisory services and contact us today to see how we can help you level up and meet your goals.
The Zonda New Home Lot Supply Index (LSI) is built on proprietary, industry-leading data that covers the production new home market across the United States. The index values represent single-family vacant developed lot supply, lots that are ready to be built on, relative to equilibrium. Released quarterly, the New Home LSI provides an unrivaled look into the lot markets across the country, offering a current quarter snapshot as well as insight into the directional trend.
The New Home LSI is calculated based on each markets’ specific equilibrium as determined by our team of local experts and historical activity. The comparative current value is adjusted to capture the “true” months of supply figure by applying a greater weight to vacant developed lots in subdivisions with more starts activity. Each index value is associated with a phrase highlighting the current lot supply dynamics. A value of 100, represents perfect equilibrium, while a value of 125 and above equals “Significantly Oversupplied”, 115-125 – “Slightly Oversupplied”, 85-115 – “Appropriately Supply”, 75-85 – “Slightly Undersupplied”, and 75 and below – “Significantly Undersupplied.”
The foundation of the index is a quarterly release conducted by Zonda. It is necessary to monitor residential lot supply to understand how new home markets may be impacted by the incoming pipeline.

Chief Economist