New Home Market Update
Valerie Sheets
vsheets@zondahome.com
707-949-294-9557
The New Home Lot Supply Index (LSI) hit a turning point in the third quarter with the value rising both month-over-month and year-over-year. The LSI is still in significantly undersupplied territory but the fruits of the labor on the land development side are finally resulting in a bit more inventory.
The New Home Lot Supply Index (LSI) is backed by data from Zonda and shows lot supply loosened year-over-year across the United States. The index is a residential real estate indicator based on the number of single-family vacant developed lots and the rate at which those lots are absorbed.
“One thing that has plagued the housing market over the past couple years was that demand was running 100 miles a minute and every part of the industry was struggling to keep up,” said Ali Wolf, chief economist at Zonda. “While the land market remains significantly undersupplied, the uptick in the third quarter captures that the lower levels of housing demand are finally allowing the industry to catch up a bit.”
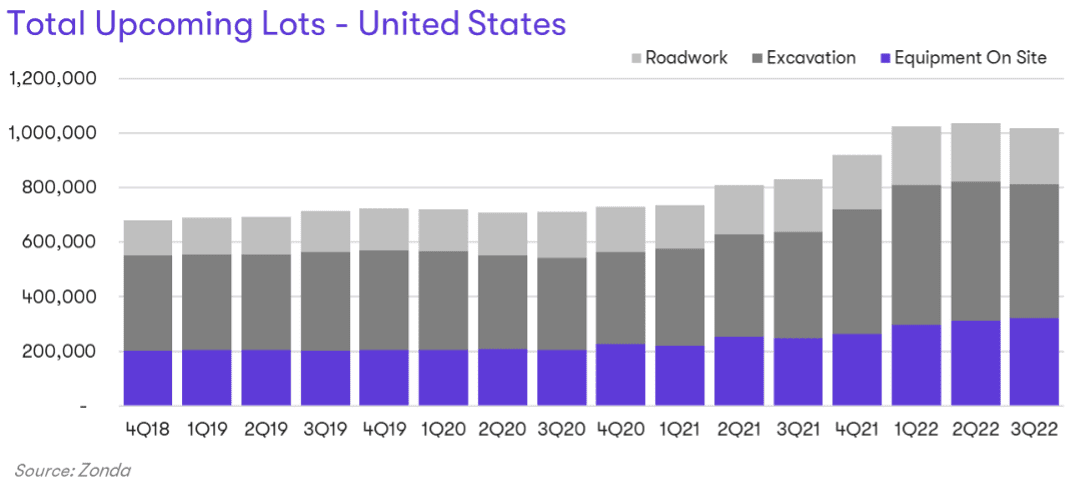
Zonda also records future lots through the stages of development. The stages range from raw land through streets in, which is the last step before the lot becomes a vacant developed lot. Zonda groups the last few stages into a classification called total upcoming lots, which indicates delivery within the next 12 months.
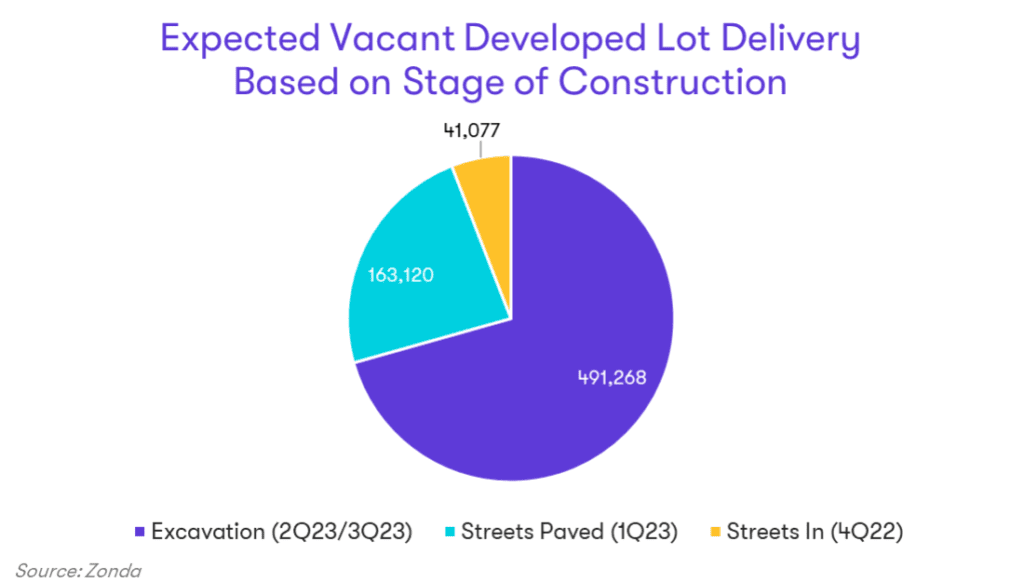
Total upcoming lots for 3Q22 increased 23% year-over-year but fell 2% from last quarter. The largest annual gains among the total upcoming lots came in the equipment on-site stage, which grew 30% from the same period last year. The largest share of total upcoming lots is in the excavation stage, making up 71% nationally and has an expected delivery between 2Q23 and 3Q23 (the range represents different timeframes from local entitlement processes). Note, not all the lots in excavation will match Zonda’s estimated timeline.
“It is encouraging to see growth in vacant developed lots and total upcoming lots after hitting historic lows earlier this year,” Wolf said. “The key thing we are tracking from here is the path over the next few quarters following the slower housing market and resulting reduction in overall housing starts.”
Get more granular custom housing market data based on your region and your business needs. Learn more about our Advisory services and contact us today to see how we can help you level up and meet your goals.
The Zonda New Home Lot Supply Index (LSI) is built on proprietary, industry-leading data that covers the production new home market across the United States. The index values represent single-family vacant developed lot supply, lots that are ready to be built on, relative to equilibrium. Released quarterly, the New Home LSI provides an unrivaled look into the lot markets across the country, offering a current quarter snapshot as well as insight into the directional trend.
The New Home LSI is calculated based on each markets’ specific equilibrium as determined by our team of local experts and historical activity. The comparative current value is adjusted to capture the “true” months of supply figure by applying a greater weight to vacant developed lots in subdivisions with more starts activity. Each index value is associated with a phrase highlighting the current lot supply dynamics. A value of 100, represents perfect equilibrium, while a value of 125 and above equals “Significantly Oversupplied”, 115-125 – “Slightly Oversupplied”, 85-115 – “Appropriately Supply”, 75-85 – “Slightly Undersupplied”, and 75 and below – “Significantly Undersupplied.”
The foundation of the index is a quarterly release conducted by Zonda. It is necessary to monitor residential lot supply to understand how new home markets may be impacted by the incoming pipeline.

Chief Economist