New Home Market Update
Valerie Sheets
vsheets@zondahome.com
707-949-294-9557
The New Home Lot Supply Index (LSI) came in at 38.0 for 2Q22, down 9.3% compared to last year. Current vacant developed lot inventory is expected to improve heading into 2023.
The New Home Lot Supply Index, backed by data from Zonda, shows lot supply tightened year-over-year across the United States. The index is a residential real estate indicator based on the number of single-family vacant developed lots and the rate at which those lots are absorbed.
“The constrained availability of lots over the past couple of years, along with the labor and material shortages, put a lid on overall homebuilding activity,” said Ali Wolf, chief economist at Zonda. “While vacant developed lot inventory tightened slightly in the second quarter, the key number to track going forward is lots under development, which are up 28% compared to last year.”
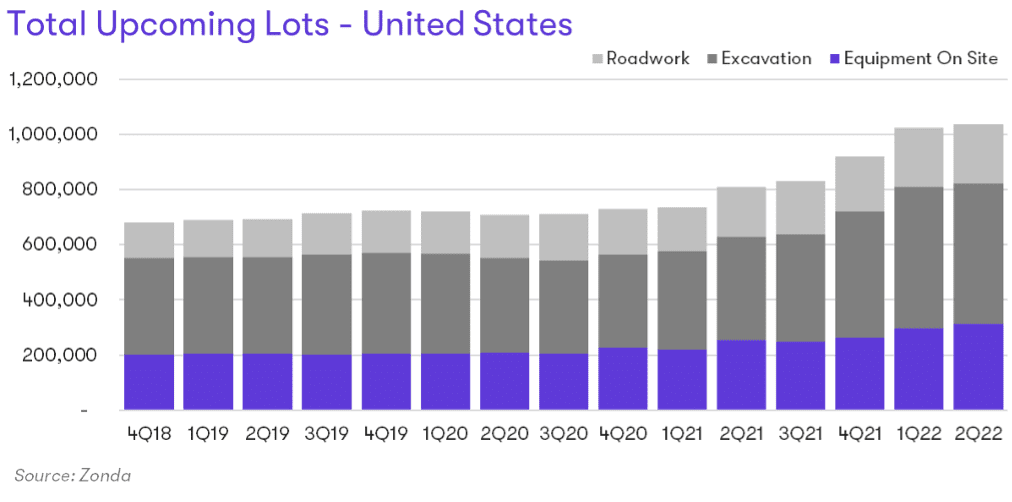
Zonda also records future lots through the stages of development. The stages range from raw land through streets in, which is the last step before the lot becomes a vacant developed lot. Zonda groups the last few stages into a classification called total upcoming lots, which indicates delivery within the next 12 months.
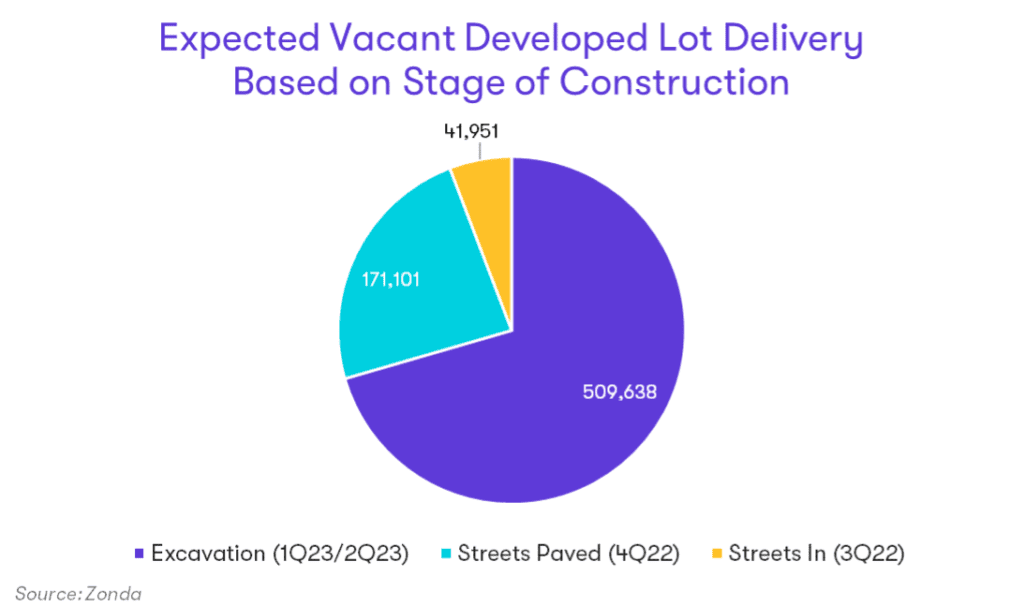
Total upcoming lots for 2Q22 increased 28% year-over-year and grew 1.2% from last quarter. The largest annual gains among the total upcoming lots came in the excavation stage, which grew 36.5% from the same period last year. Lots in excavation represent 71% of the total upcoming lots. These lots are estimated to become vacant developed lots between 1Q23 and 2Q23. Note, not all the lots in excavation will match Zonda’s estimated timeline.
“The housing market was moving a mile a minute heading into 2022,” said Wolf. “What we’ve seen is that consumers have responded to higher home prices and mortgage rates by slowing demand. Housing starts are tied to housing demand. 87% of the builders surveyed by Zonda anticipate slowing new construction in response to the shifting market.”
Tune in on August 18 for the Q3 Housing Forecast webinar. Chief Economist Ali Wolf will deliver a national housing market update followed by regional updates for Phoenix, Denver, and Salt Lake City.
Learn more about other upcoming Zonda events and webinars.
Get more granular custom housing market data based on your region and your business needs. Learn more about our Advisory services and contact us today to see how we can help you level up and meet your goals.
The Zonda New Home Lot Supply Index (LSI) is built on proprietary, industry-leading data that covers the production new home market across the United States. The index values represent single-family vacant developed lot supply, lots that are ready to be built on, relative to equilibrium. Released quarterly, the New Home LSI provides an unrivaled look into the lot markets across the country, offering a current quarter snapshot as well as insight into the directional trend.
The New Home LSI is calculated based on each markets’ specific equilibrium as determined by our team of local experts and historical activity. The comparative current value is adjusted to capture the “true” months of supply figure by applying a greater weight to vacant developed lots in subdivisions with more starts activity. Each index value is associated with a phrase highlighting the current lot supply dynamics. A value of 100, represents perfect equilibrium, while a value of 125 and above equals “Significantly Oversupplied”, 115-125 – “Slightly Oversupplied”, 85-115 – “Appropriately Supply”, 75-85 – “Slightly Undersupplied”, and 75 and below – “Significantly Undersupplied.”
The foundation of the index is a quarterly release conducted by Zonda. It is necessary to monitor residential lot supply to understand how new home markets may be impacted by the incoming pipeline.

Chief Economist