
Zonda’s New Home Lot Supply Index (LSI) for 2Q26, rose for the eighth consecutive quarter and showed lot supply loosened both year-over-year and quarter-over-quarter across the United States. The index is a residential real estate indicator based on the number of single-family vacant developed lots (VDL) and the rate at which those lots are absorbed via housing starts.
- The New Home LSI came in at 85.2 for 2Q26, representing a 24.6% increase from 2Q25. This quarter, the market shifted from “slightly undersupplied” to “appropriately supplied.” The last time the national market was “appropriately supplied” was 1Q16.
- On a quarter-over-quarter basis, supply increased by 0.7% from 1Q26.
- The LSI counts the total vacant developed lot supply and adjusts it for overall starts activity.
“The national lot market has reached an important milestone,” said Ali Wolf, chief economist for Zonda and NewHomeSource. “For the first time since 2016, the market is considered ‘appropriately supplied.’ The shift reflects both improving lot availability and a moderation in housing starts as builders respond to a softer demand environment. While the national market has returned to balance, conditions still vary significantly from one market to another.”
Importantly, the latest LSI was sitting right on the boundary between “slightly undersupplied” and “appropriately supplied.” Depending on how housing starts trend in the third quarter, the index could quickly move back into undersupplied territory.
In 2Q26, lot supply loosened year-over-year across nearly all major metropolitan areas. Boise joined New York and Minneapolis as the only markets where supply conditions tightened year-over-year.
- More markets trended up and were rated “appropriately supplied” or “oversupplied” in the second quarter, but 13 of 30 were still categorized as “significantly undersupplied.”
- The markets where land supply loosened the most on a year-over-year basis were San Diego, Baltimore, and Denver. Related, 2Q starts were down over the same period in all three markets, with San Diego posting the largest decline of 47%.
- Boise tightened the most compared to the same time last year, falling from 67.2 to 58.6, and was rated “significantly undersupplied.” Miami and San Diego continued the trend of being the tightest lot markets in the country, with the latter significantly held back by local jurisdictions.
- Denver, Austin, and Atlanta were the top three markets for loosest lot supply in 2Q, unchanged from last quarter. San Francisco joined Dallas in the “slightly oversupplied” category, while nine other markets were “appropriately supplied.” The remaining 18 markets were “undersupplied.”
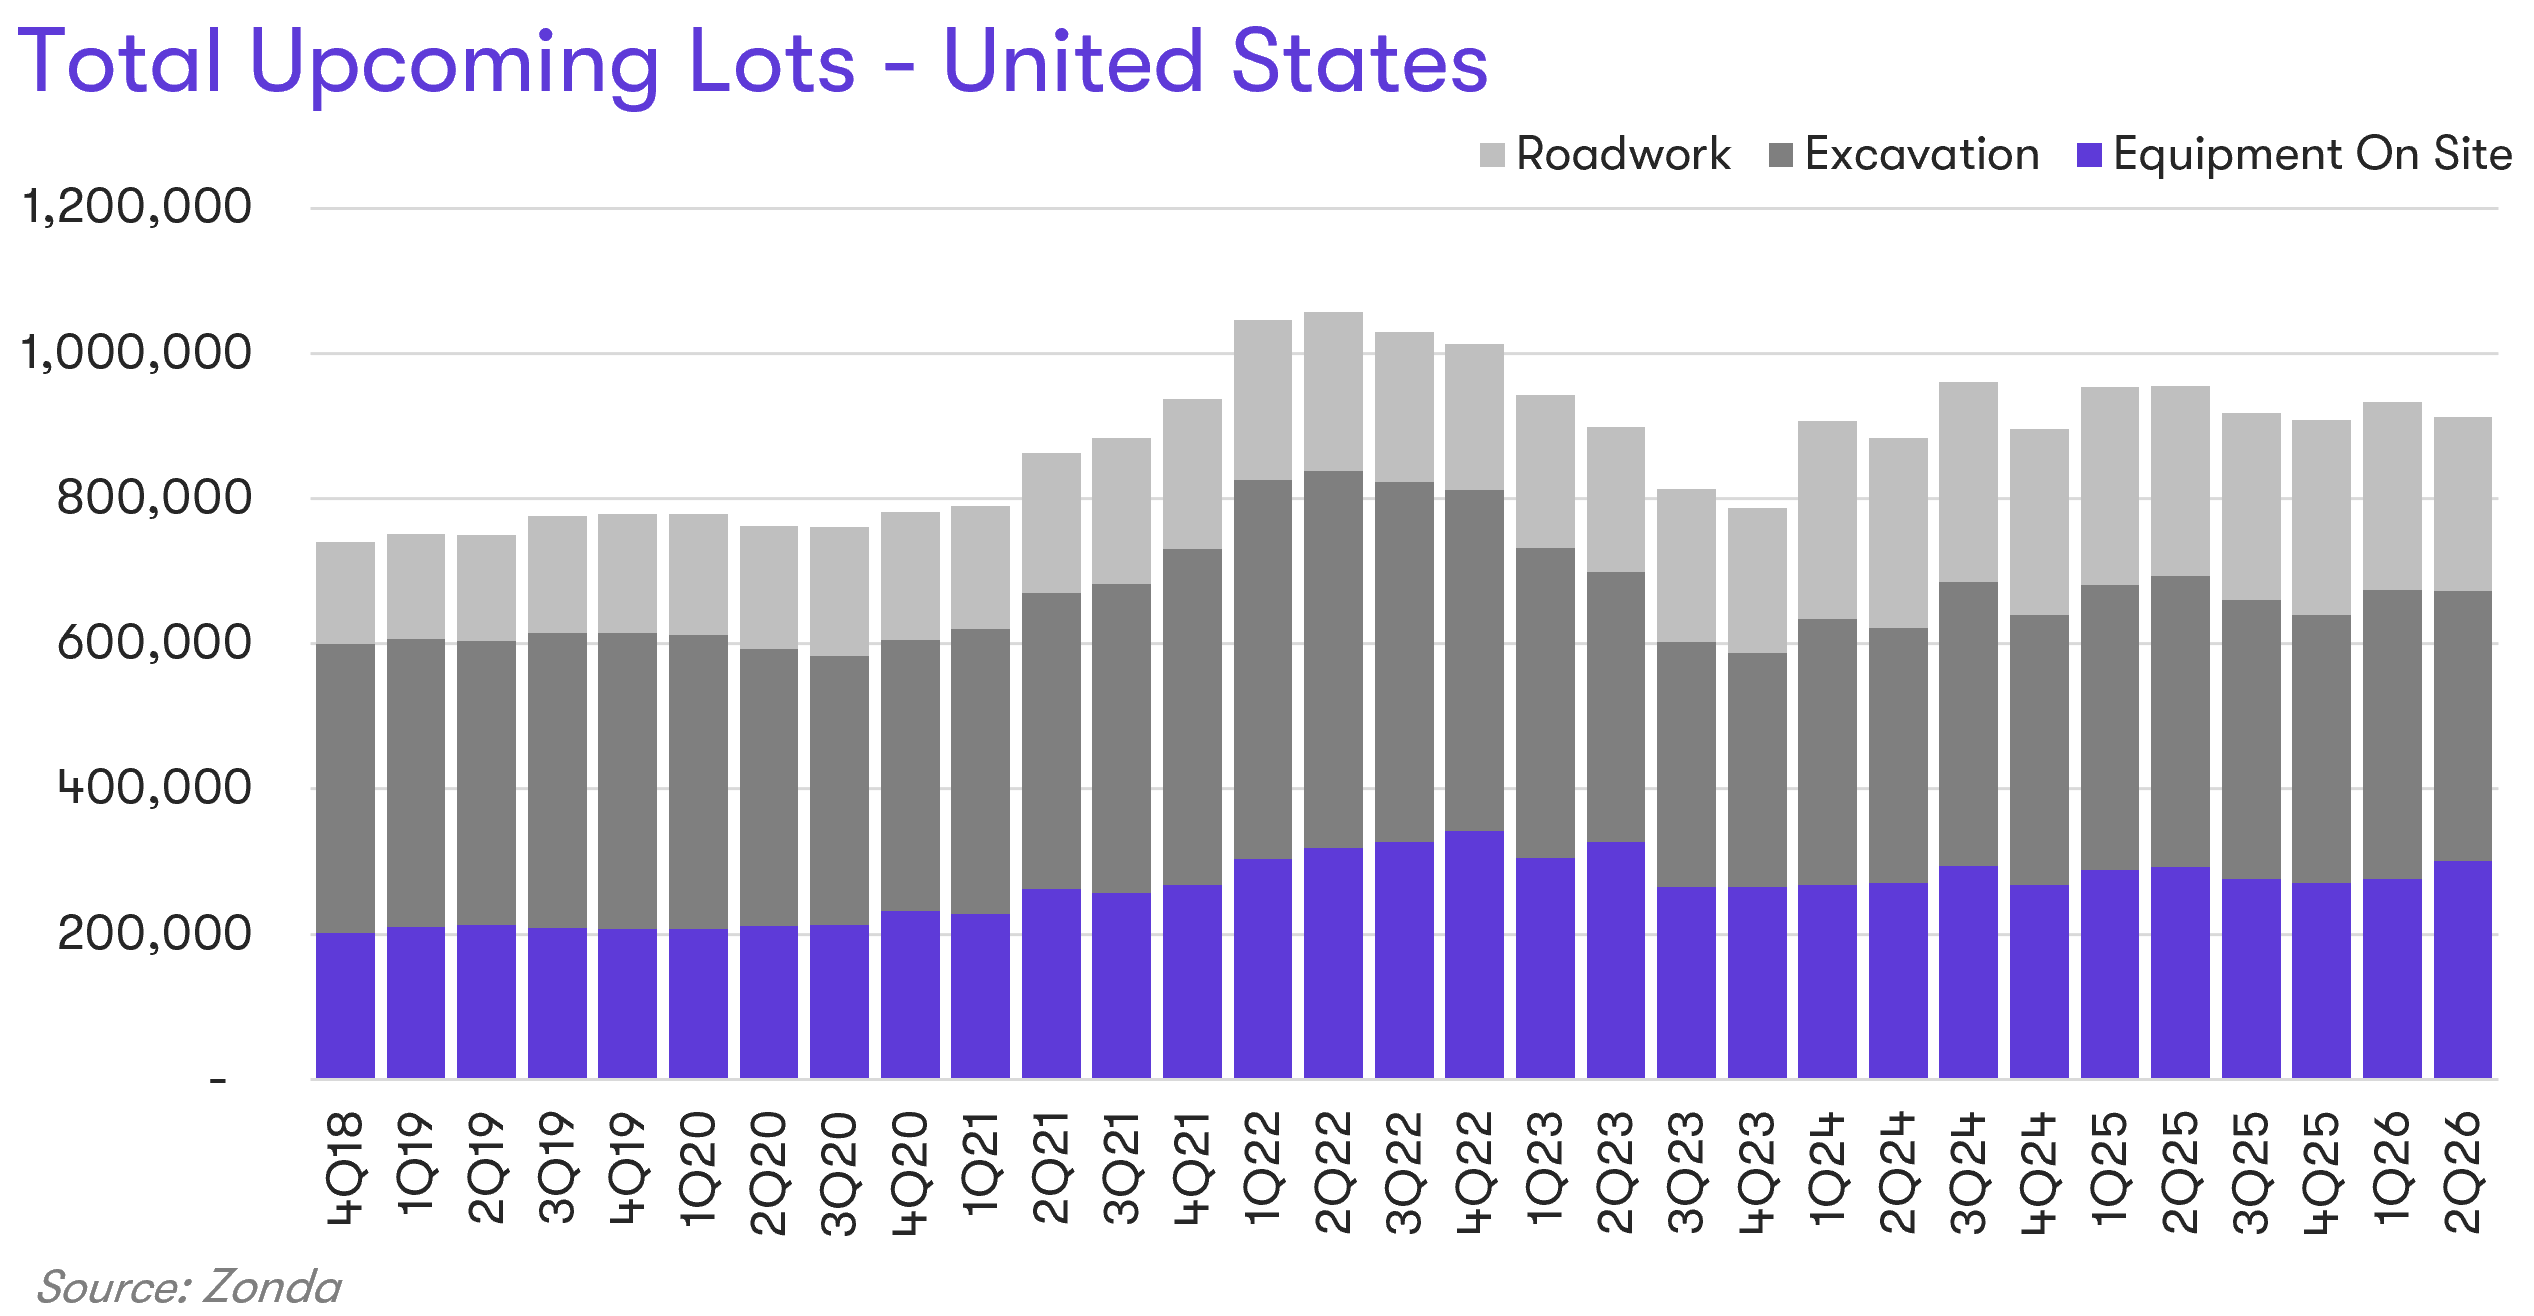
Zonda also records future lots through the stages of development. The stages range from raw land through streets in, which is the last step before the lot becomes a vacant developed lot. Zonda groups the last few stages into a classification called total upcoming lots, which typically indicates delivery over the next 12-18 months.
Total upcoming lots in 2Q26 decreased 4.5% year-over-year and 2.2% quarter-over-quarter. These types of lots in the second quarter were down 13.6% from the 2022 peak but were up 21.4% compared to the same quarter in 2019.
Among total upcoming lots, roadwork was down 8.6% year-over-year. Roadwork is comprised of the two smaller stages-streets paved and streets in-and represents the last step in lot development. Lots in the excavation stage were down 7.0% year-over-year, while those with equipment on site were up 2.6%.
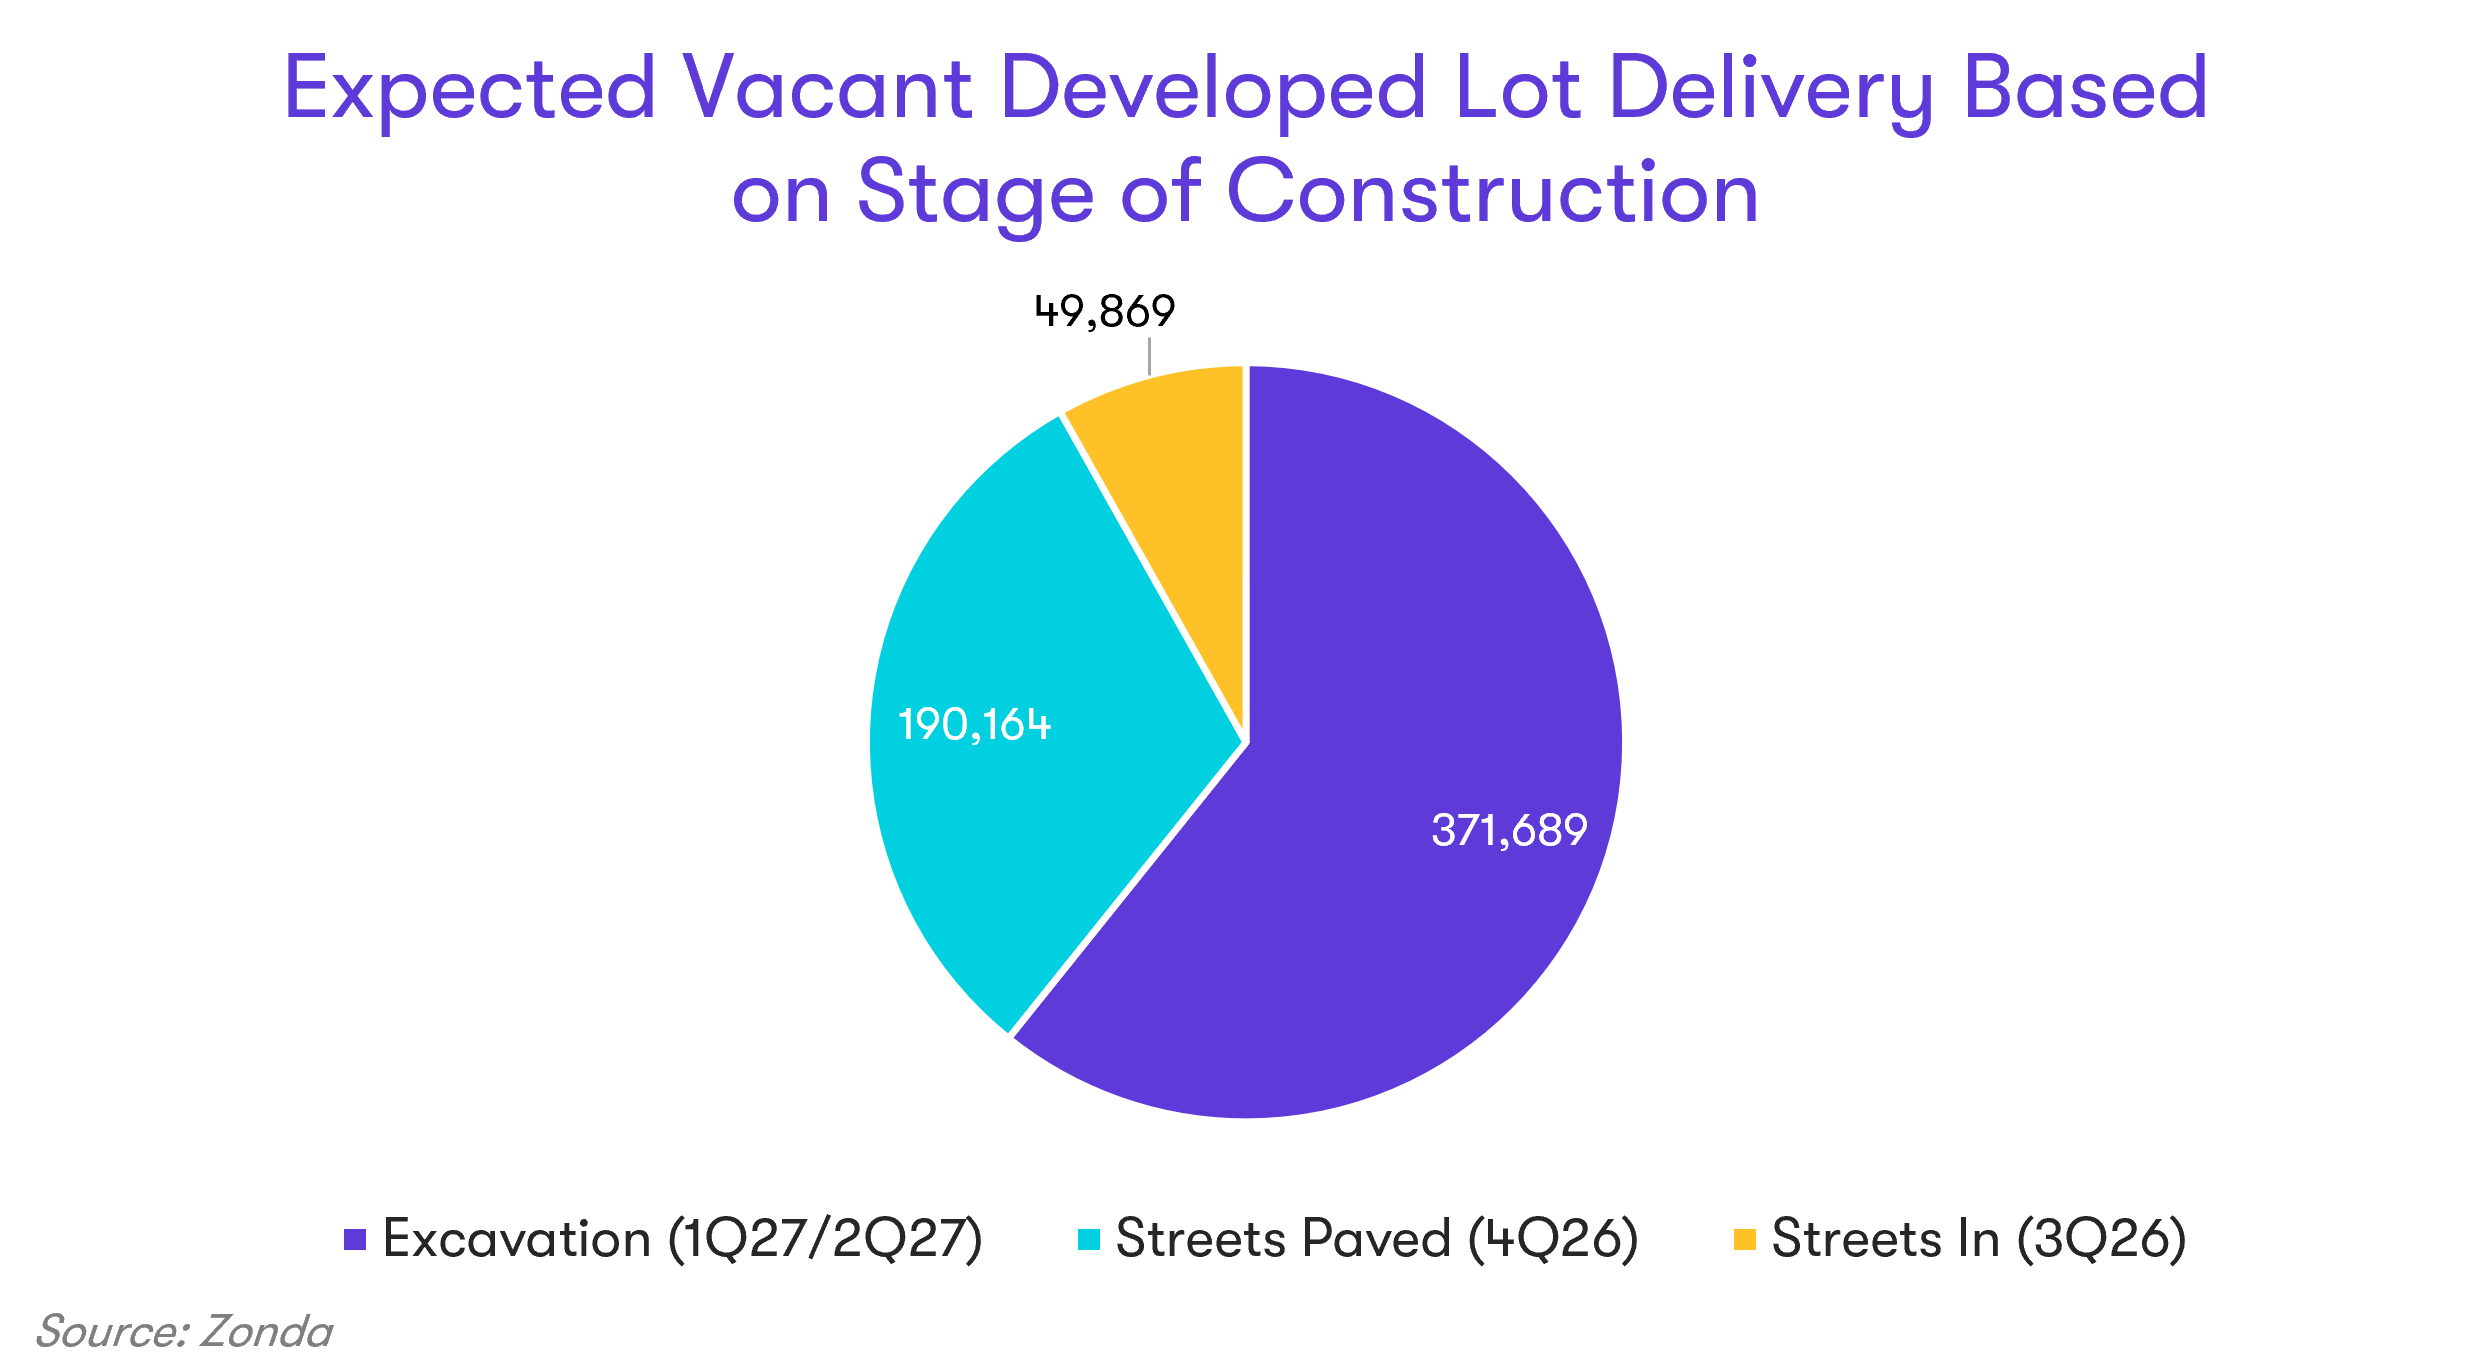
The largest share of total upcoming lots were in the excavation stage in 2Q26, totaling 372K. These lots have an expected delivery between 1Q27 and 2Q27 (the range represents different timeframes from local entitlement processes). Note, not all of the lots in excavation will match Zonda’s estimated timeline.
“Builders continue to strike a careful balance between preparing for future demand and avoiding excess supply,” Wolf said. “Upcoming lot activity declined in the second quarter as developers remained disciplined about bringing new lots through the pipeline. While activity slowed, the development pipeline remained active, highlighting a mindset of cautious optimism. Developers are exhibiting restraint today while still positioning for future opportunities.”
Read past reports
Are you interested in reading past New Home Lot Supply Index reports? Access our report library to learn more.
Go deeper with Zonda Advisory services
Get more granular custom housing market data based on your region and your business needs. Learn more about our Advisory services to see how we can help you level up and meet your goals.
Methodology
The Zonda New Home Lot Supply Index (LSI) is built on proprietary, industry-leading data that covers the production new home market across the United States. The index values represent single-family vacant developed lot supply, lots that are ready to be built on, relative to equilibrium. Released quarterly, the New Home LSI provides an unrivaled look into the lot markets across the country, offering a current quarter snapshot as well as insight into the directional trend.
The New Home LSI is calculated based on each markets’ specific equilibrium as determined by our team of local experts and historical activity. The comparative current value is adjusted to capture the “true” months of supply figure by applying a greater weight to vacant developed lots in subdivisions with more starts activity. Each index value is associated with a phrase highlighting the current lot supply dynamics. A value of 100, represents perfect equilibrium, while a value of 125 and above equals “Significantly Oversupplied”, 115-125 – “Slightly Oversupplied”, 85-115 – “Appropriately Supply”, 75-85 – “Slightly Undersupplied”, and 75 and below – “Significantly Undersupplied.”
The foundation of the index is a quarterly release conducted by Zonda. It is necessary to monitor residential lot supply to understand how new home markets may be impacted by the incoming pipeline.