New Home Market Update
Valerie Sheets
vsheets@zondahome.com
707-949-294-9557
The New Home Lot Supply Index (LSI) came in at 38.6 for 1Q22, representing a continuation of the flattening seen last quarter.
The New Home Lot Supply Index, backed by data from Zonda, shows lot supply tightened year-over-year across the United States. The index is a residential real estate indicator based on the number of single-family vacant developed lots and the rate those lots are absorbed.
“Lot inventory flattened quarter-over-quarter, which represents a notable change from the consistent decline over the past couple of years,” said Ali Wolf, chief economist at Zonda. “Homebuilding starts with lots and the flattening trend captures the time and money invested in land development since the start of the pandemic.”
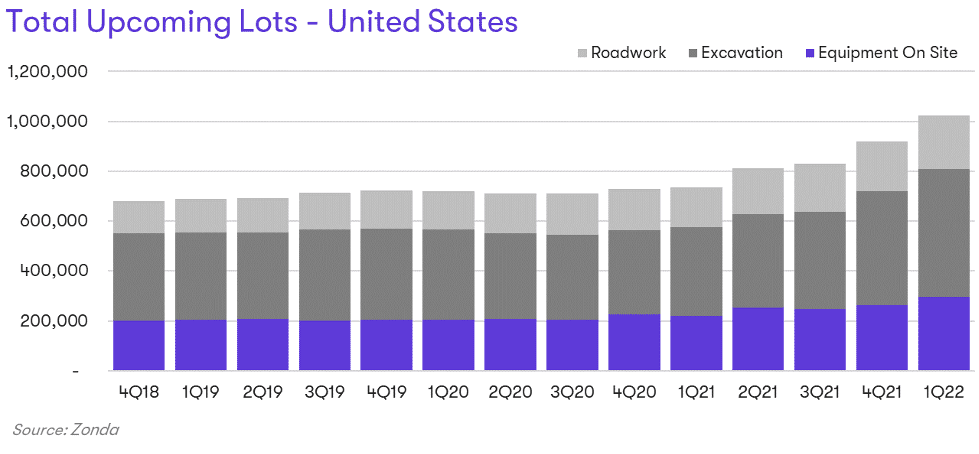
Zonda tracks future lots through the stages of development. The stages range from raw land through streets in, which is the last step before the lot becomes a VDL. Zonda groups the last few stages into a classification called total upcoming lots, which implies delivery within the next 12 months.
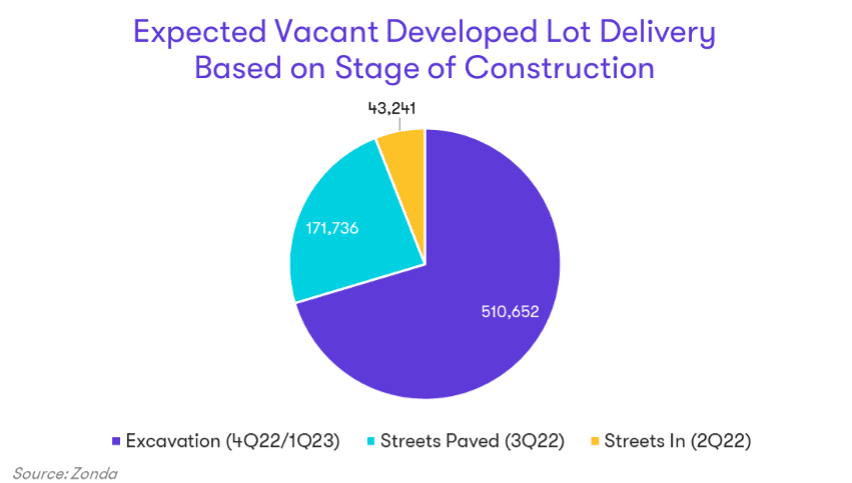
Total upcoming lots for 1Q22 increased 39% year-over-year and 11% from last quarter alone. The largest annual gains among the total upcoming lots came in the equipment on-site stage, which grew 40% from the same time last year and implies expected delivery in the following quarter. The current majority of total upcoming lots fall in the excavation stage, making up 70% nationally and have an expected delivery between 4Q22 and 1Q23 (the range represents different timeframes from local entitlement processes). Note, not all the lots in excavation will match Zonda’s estimated timeline.
“Homebuilders are finding it difficult to quickly get more homes built because of the land, labor, material, and governmental shortages and delays,” says Wolf. “The same challenges apply to land and lot development, which is impacting availability. However, there is light at the end of the tunnel. Our total upcoming lots data tells us more vacant developed lots should become available over the next 12 months.”
Tune in on Tuesday, May 31 for the Q2 Housing Forecast webinar. Chief Economist Ali Wolf will deliver a national housing market update and Senior Vice President of Advisory, Kristine Smale will hone in on Florida markets with regional updates for Tampa, Jacksonville, Central Florida/Orlando, and South Florida.
We’ll take a closer look at market opportunities and challenges to address these critical questions:
Register for the webinar today, and learn more about other upcoming Zonda events and webinars.
The Zonda New Home Lot Supply Index (LSI) is built on proprietary, industry-leading data that covers the production new home market across the United States. The index values represent single-family vacant developed lot supply, lots that are ready to be built on, relative to equilibrium. Released quarterly, the New Home LSI provides an unrivaled look into the lot markets across the country, offering a current quarter snapshot as well as insight into the directional trend.
The New Home LSI is calculated based on each markets’ specific equilibrium as determined by our team of local experts and historical activity. The comparative current value is adjusted to capture the “true” months of supply figure by applying a greater weight to vacant developed lots in subdivisions with more starts activity. Each index value is associated with a phrase highlighting the current lot supply dynamics. A value of 100, represents perfect equilibrium, while a value of 125 and above equals “Significantly Oversupplied”, 115-125 – “Slightly Oversupplied”, 85-115 – “Appropriately Supply”, 75-85 – “Slightly Undersupplied”, and 75 and below – “Significantly Undersupplied.”
The foundation of the index is a quarterly release conducted by Zonda. It is necessary to monitor residential lot supply to understand how new home markets may be impacted by the incoming pipeline.

Chief Economist