Combine the right person with the right software and you can turn a one-man department into a companywide intelligence hub.
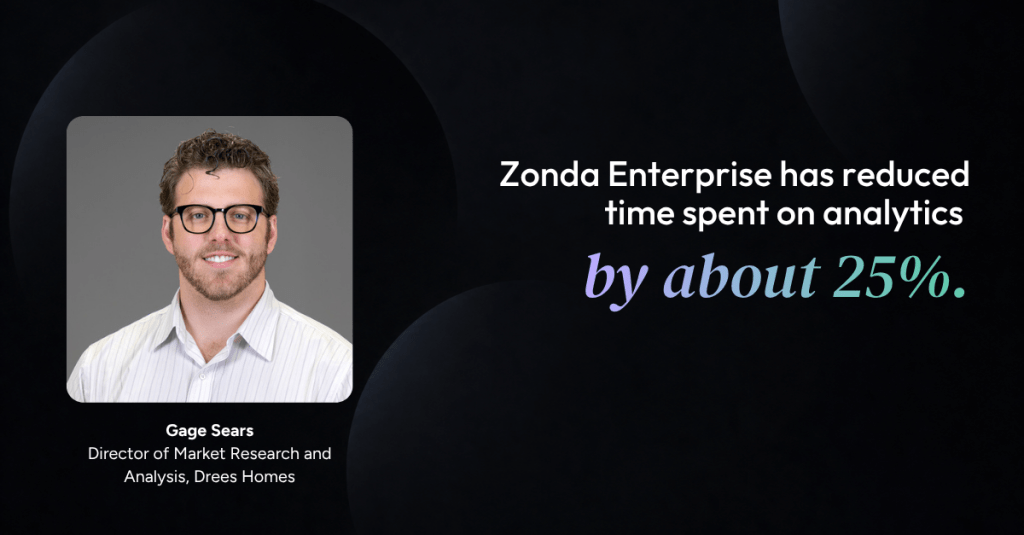
For Drees Homes, the right person is Gage Sears and the software is Zonda Enterprise.
As the director of market research and analysis, Sears supports 15 divisions and works with land and sales teams across the country to translate market data into faster, clearer decisions.
Here, Sears explains how Drees is using Zonda Enterprise to help teams focus on the story the data is telling. This interview has been edited for space and clarity.
What was Drees trying to improve in its use of Zonda Enterprise?
When I joined Drees, we already had Zonda Enterprise, but we weren’t facilitating it in the way I thought we could. Drees has made a conscious effort to better understand our strategic positioning within each market, and Zonda gives us access to the data to do that.
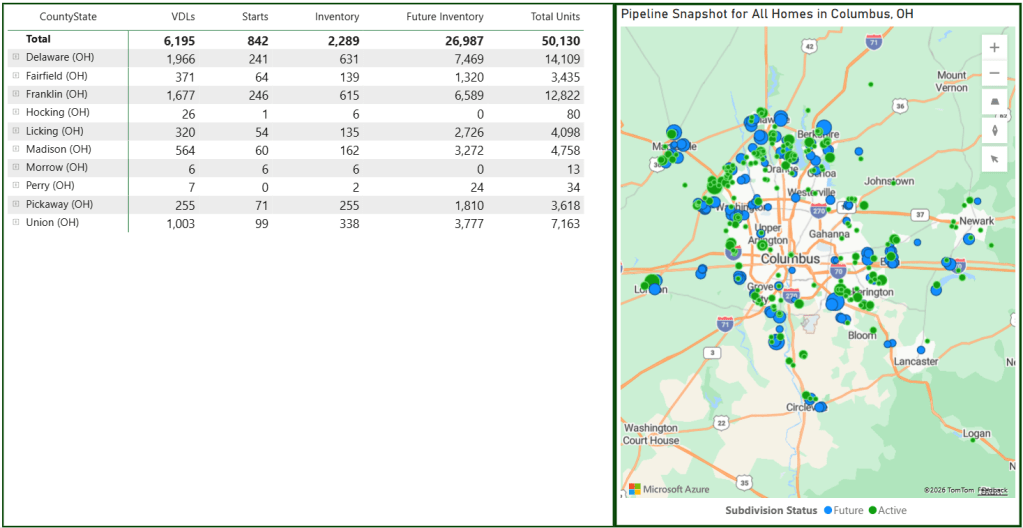
When you’re supporting 15 divisions as a team of one, efficiency matters. The value of Zonda is that it gives us information at scale, from the 30,000-foot market view down to individual lots and construction status.
How does Zonda support competitive analysis?
At Drees, we use a tool called CAPA, which stands for competition and product analysis. Before, someone building a competitive analysis had to visit builder websites or model homes, collect base prices and community information, and manually enter everything into Excel.
“Focus on the story the data within Zonda is telling.”
Gage Sears
I still encourage teams to be in the field. Boots-on-the-ground information is important. But the manual data entry took a lot of time. If you were looking at eight communities with 10 floor plans each, just typing in the plan names meant entering 80 items.
I tied our CAPA workbook to Zonda’s data tables through our FTP connection. Now, a team member can select the market, builder, and project, and the workbook pulls in plan names, pricing history, configurations, square footage, and sales history. That helps them get to the analytics faster.
What kind of time savings has that created?
We estimate it has reduced time spent on analytics by about 25%. If a competitive analysis used to take about eight hours, our teams now think it takes five to six.
There are still manual pieces—MLS data, feature differences, HOA dues, amenities, lot widths, ceiling heights, and quality checks. But now a team can build the analysis in about half a day and still meet to discuss the community that same day.
Why does that matter beyond saving time?
It helps us make better decisions faster. Every time we underwrite a deal, we build a CAPA, and that analysis is maintained through underwriting and feasibility. But there can be a long lag between signing up a deal and starting vertical construction. By then, the market may have changed.
Now, our sales agents can build and maintain a CAPA using Zonda data to review pricing, pace, product positioning, features, and elevations month over month. I’m training roughly 200 sales agents across the country on how to use that data, and it’s also being reviewed by local leadership and our executive team.
What is a less obvious win?
Data literacy. On a recent call, we were looking at a Zonda line graph comparing one of our active communities to nearby competitors. At first, there was too much information. I filtered it down to our community and the two most relevant competitors, and the conversation immediately opened up. The team started debating product positioning, pricing, and value propositions, and left with action items.
What advice would you give a new Enterprise user?
Focus on the story the data within Zonda is telling. There is a lot of information, but Zonda gives you tools to filter it down. Once you understand one project’s story, you’ll find yourself in Enterprise a whole lot more.