Products

Enterprise 7.8: Smarter Maps, Custom Boundaries & Cleaner Insights

Sep 26, 2025

Enterprise 7.8 is here—with enhanced maps, updated school data, custom boundaries, larger exports, and more reliable reporting. These updates make it easier than ever to visualize opportunities, understand market conditions, and plan your next move with confidence. 

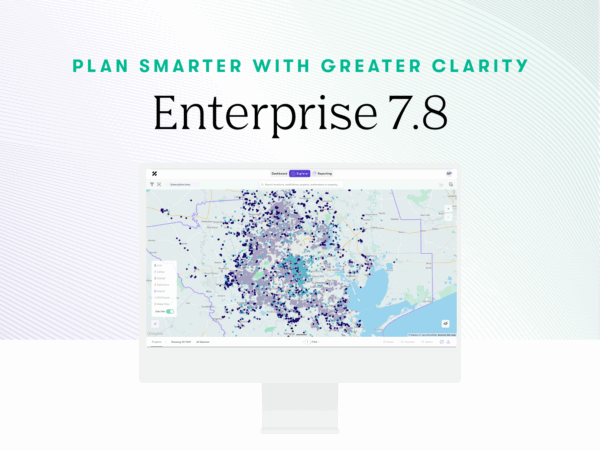
See Your Pipeline Come to Life with Smarter Maps

Status Dot Maps

Quickly see the status of your entire pipeline—Projects, Subdivisions, Master Plans, Listings, Closings, and Build-to-Rent (BTR) Projects—on one interactive, color-coded map.

Use it to: 

  • Instantly understand project status from planning to closing
  • Zoom to market level without clustering for clear local insights
  • Spot gaps and opportunities across regions
  • Share intuitive visuals with teams and stakeholders

Map Labels

Markers, saved boundaries, and standard geography layers now display labels—so you can immediately identify what you’re looking at. Export labeled map images for clean, professional reports.

Power Decisions with Smarter School Insights

Updated School Ratings & Test Scores

School quality drives decisions—now you can see the latest Great Schools test scores, ratings, and other metrics right inside Enterprise. You can see new School Ratings in Subdivision, Project, BTR Project, and Property Profiles. Ratings are also sortable in project tables, making it easier to compare.

Use these insights to:

  • Target high-demand areas near top-rated schools
  • Price confidently with clear, comparable school data
  • Differentiate communities in listings and marketing
  • Streamline site selection with all education data in one place

Spot Tomorrow’s Buyers with Fresh 2024 Demographics

The Demographics Snapshot, Population Trends, Household Trends, and Household Income by Age reports are updated with the latest 2024 data.

Use this to:

  • Spot early growth markets through updated trends
  • Align product mix with income and age dynamics
  • Tailor floor plans and pricing to evolving buyers
  • Support land and investment strategy with accurate snapshots

Draw the Lines That Matter to You

User-Imported Boundaries

Upload your own KML files to define custom submarkets. Combine them with standard Zonda submarkets or drawn shapes for hybrid analysis. Export datasets with boundary tags to know exactly what falls within your area.

Download Boundaries

Export active boundaries as KMLs to use or edit in external applications, share with your team, or reimport into Enterprise.

Scale Up with Bigger, Better, More Reliable Data

Larger Reports & Exports

Run market-level analysis more easily—exports now scale up to 3,000 entities, making it possible to run reports and exports in larger market areas.

Data Consistency & Market Report Enhancements

This release delivers stronger alignment across segmentation, location data, and report outputs. Market Reports are now more complete and visually consistent, with enriched sections on pricing, economy, and new home premiums.

These improvements mean:

  • More reliable and consistent reporting
  • Cleaner visuals for easier interpretation
  • Greater trust in the data guiding your decisions

Ready to Explore?

Enterprise 7.8 is live. Log in now to explore the new tools—or connect with your Customer Success Manager for a walkthrough tailored to your strategy.  Not yet a Zonda Enterprise subscriber?  See how Enterprise can give you the clarity and confidence to stay ahead.

Recent news