2025 Cost vs. Value Report
Zonda PR
pr@zondahome.com
Zonda tracks 85% of the production new home market across the United States. Given the proprietary database, Zonda is uniquely positioned to capture trends and changes in the new home market. This report showcases the latest housing trends in the new home market for September 2025.

New home sales have been rangebound for the last year as consumers grapple with mixed messages, widespread unaffordability, and economic uncertainty. As a result, builders, whose business is to both build and sell homes, have become more resourceful in how they attract and work with today’s shoppers. Builders are actively supporting the market through the continued and increasingly creative use of incentives, strategic price cuts where needed, and a focus on providing buyers with more options.
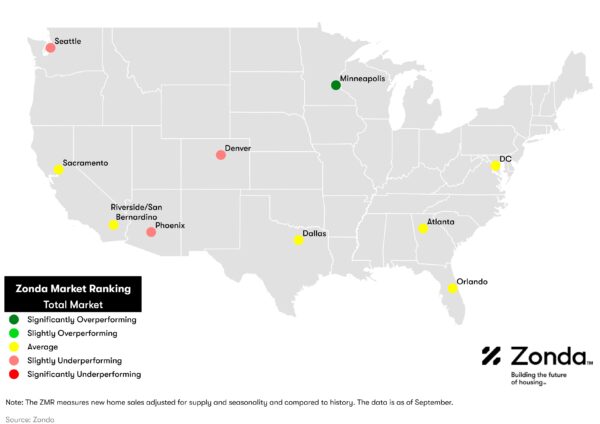
 These efforts, paired with mortgage rates that averaged below 6.5% in September (down from 7%+ earlier in the year), helped lift sales modestly month-over-month. Still, the overall new home market continued to be classified as average by our Zonda Market Ranking.
“We asked builders about the impact of the recent interest rate shift on their business in September,” said Ali Wolf, chief economist for Zonda and NewHomeSource. “Most reported that they hadn’t noticed much of a difference, describing the market as slow and noting that consumers still seem spooked by broader macro conditions. All of this is a good reminder that for consumers to make the largest purchase of their lives, they need a reason to move, adequate affordability, and confidence in where the market is headed.”
Zonda’s new home sales metric counts the number of new home contract sales each month and accounts for both cancellations and seasonality. This metric shows there were 716,406 new homes sold in September on a seasonally adjusted annualized rate. This was a gain of 3.1% from last month, but flat from a year ago. On a non-seasonally adjusted basis, 57,263 homes were sold, 0.6% higher than last year and 8.6% above the same month in 2019.
Zonda’s New Home Pending Sales Index (PSI) was created to help account for fluctuations in supply by combining both total sales volume with the average sales rate per month per community. The September PSI came in at 141.2, representing a 6.3% decline from the same month last year. The index is currently 18.9% below cycle highs. On a month-over-month basis, seasonally adjusted new home sales increased 2.6%.
In order to add further context to sales, Zonda created the Zonda Market Ranking (ZMR). The ZMR accounts for both sales pace and volume, is seasonally adjusted, and is taken as a percentage relative to a baseline market average. Based on the percentage above or below baseline, markets are bucketed into performance groups ranging from significantly underperforming to significantly overperforming relative to historical activity.
The map below shows a snapshot of top production markets by region. Zonda also offers the ZMR for entry-level, move-up/move-down, and high-end markets. Subscribers of the National Outlook report can access all top markets and the tiered breakdown in Zonda’s portal. Non-subscribers can access the tiered maps for the select 10 markets by clicking below.
Prices fell 1.5% for entry-level to $324,026, flattened for move-up at $516,410, and rose 2.4% for high-end homes to $929,451. The rise in high-end home prices reflects new communities opening at higher price points, improvements in design quality, larger lots and home sizes, and/or better locations.
Supplementing our data with a survey Zonda conducts monthly, 30% of builders lowered prices in September month-over-month, 65% held prices flat, and 5% raised prices. In August, for comparison, 42% of builders lowered prices, 55% held prices flat, and 3% increased prices.
Incentives are still common in today’s housing market to help address the affordability constraints for buyers. In September, 59% of new home communities offered incentives on to-be-built homes and 79% on quick move-in supply. Note, these are only publicly advertised incentives so will underrepresent overall usage.
There are currently 16,996 actively selling communities tracked by Zonda, up 1.6% from last year. On a month-over-month basis, the national figure grew 0.8%. The national community count is up for the 10th consecutive month but remains 12.0% below the same month in 2019. Zonda defines a community as anywhere where five or more units are for sale.
National quick move-ins (QMIs) totaled 39,398, up 13.1% compared to last year but 11.5% lower month-over-month. Total QMIs are 67.9% above 2019 levels. QMIs are homes that can likely be occupied within 90 days.
For many consumers, QMIs provide a great alternative to resale supply given they are brand new and (often) come with builder incentives. These homes aren’t flying off the shelf as they once did, though, so builders are still working through their backlog of inventory but are more cautious with new starts.
QMIs per community is a good way to track how new home supply looks in the context of actively selling projects. There were 2.6 QMIs per community nationally in September, up 18.4% from the 2.2 recorded this time last year, and a 2.0% increase from the last peak in 2022.
Please note, the QMI per community data aligns with this report covering September trends. Our quick move-in data is weekly, and we release the latest available at the time of publishing this report. As such, recreating the visual below with the data above will yield slightly different results.
Are you interested in seeing past National Housing Market Update and Pending Sales Index reports? Access our report library to learn more.
The Zonda New Home Pending Sales Index (PSI) is built on proprietary, industry-leading data that covers 85% of the production new home market across the United States. Reported number of new home pending contracts are gathered and analyzed each month. Released on the 15th business day of each month, the New Home PSI is a leading indicator of housing demand compared to closings because it is based on the number of signed contracts at a new home community. Zonda monitors 16,000 active communities in the country and the homes tracked can be in any stage of construction.
The new home market represents roughly 10% of all transactions, allowing little movements in supply to cause outsized swings in market activity. As a result, the New Home PSI blends the cumulative sales of activity recently sold-out projects with the average sales rate per community, which adjusts for fluctuations in supply. Furthermore, the New Home PSI is seasonally adjusted based on each markets’ specific seasonality, removes outliers, and uses June 2016 as the base month. The foundation of the index is a monthly survey conducted by Zonda. It is necessary to monitor both new and existing home sales to establish an accurate picture of the relative health of the residential real estate market.
Zonda provides data-driven housing market solutions to the homebuilding industry. From builders to building product manufacturers, mortgage clients, and multifamily executives, we work hand-in-hand with our customers to streamline access to housing data to empower smarter decisions. As a leading brand in residential construction, our mission is to advance the home building industry, because we believe better homes mean better lives and stronger communities. Together, we are building the future of housing.
Stay in the know with Zonda updates direct to your inbox. Subscribe today to receive webinar information, economics reports, podcast episodes, and more!