They Had ONE Job: Why Your Self-Tour Platform Might Be Costing You Sales
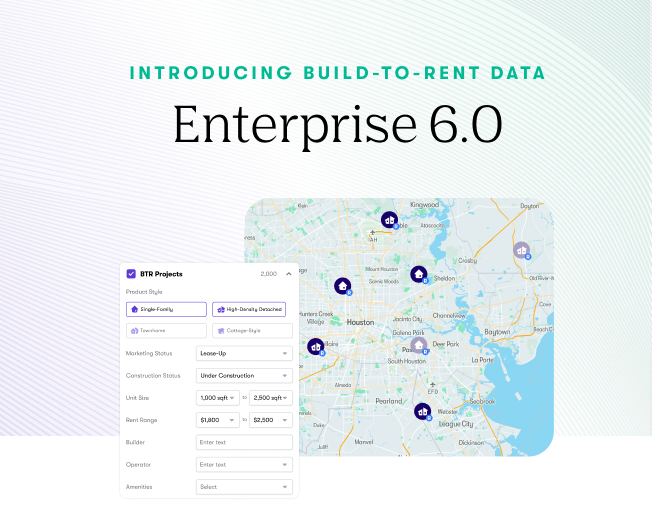
We’re thrilled to announce the release of Enterprise 6.0, a powerful update packed with new features to enhance your workflow and deepen your understanding of the housing market. This release includes the highly anticipated Enterprise with Build-to-Rent (BTR) add-on, along with several impactful improvements to usability and data access.
Enterprise with Build-to-Rent: The Future of Housing Insights

As the Build-to-Rent market continues to expand, gaining detailed insights into this sector is essential. With Enterprise 6.0, we’ve introduced the most comprehensive Build-to-Rent data set that provides users access to over 2,500 projects nationwide. Evaluate the BTR landscape with ease—whether you’re analyzing current inventory, exploring planned projects, examining product segmentation, or reviewing rental and lease-up rates.
With Enterprise with Build-to-Rent, you can now make informed, data-driven decisions in this growing market segment.
Learn more Unlock access today
New Features in Enterprise 6.0: Enhanced Navigation, Flexibility, and Access
In addition to the release of Enterprise with Build-to-Rent, Enterprise 6.0 offers new features that boost usability, personalization, and data exports. Here’s what’s new:
1. Improved Table and Map Navigation
We’ve enhanced table usability by freezing the first column while scrolling, still allowing customized column widths or newly added columns. You can also now check or uncheck selections from both the table and map, and when items are unchecked, their markers will remain visible but greyed out. These navigation improvements make it easy to select competitors by housing characteristics or location proximity while visually tracking more data across both the table and map.
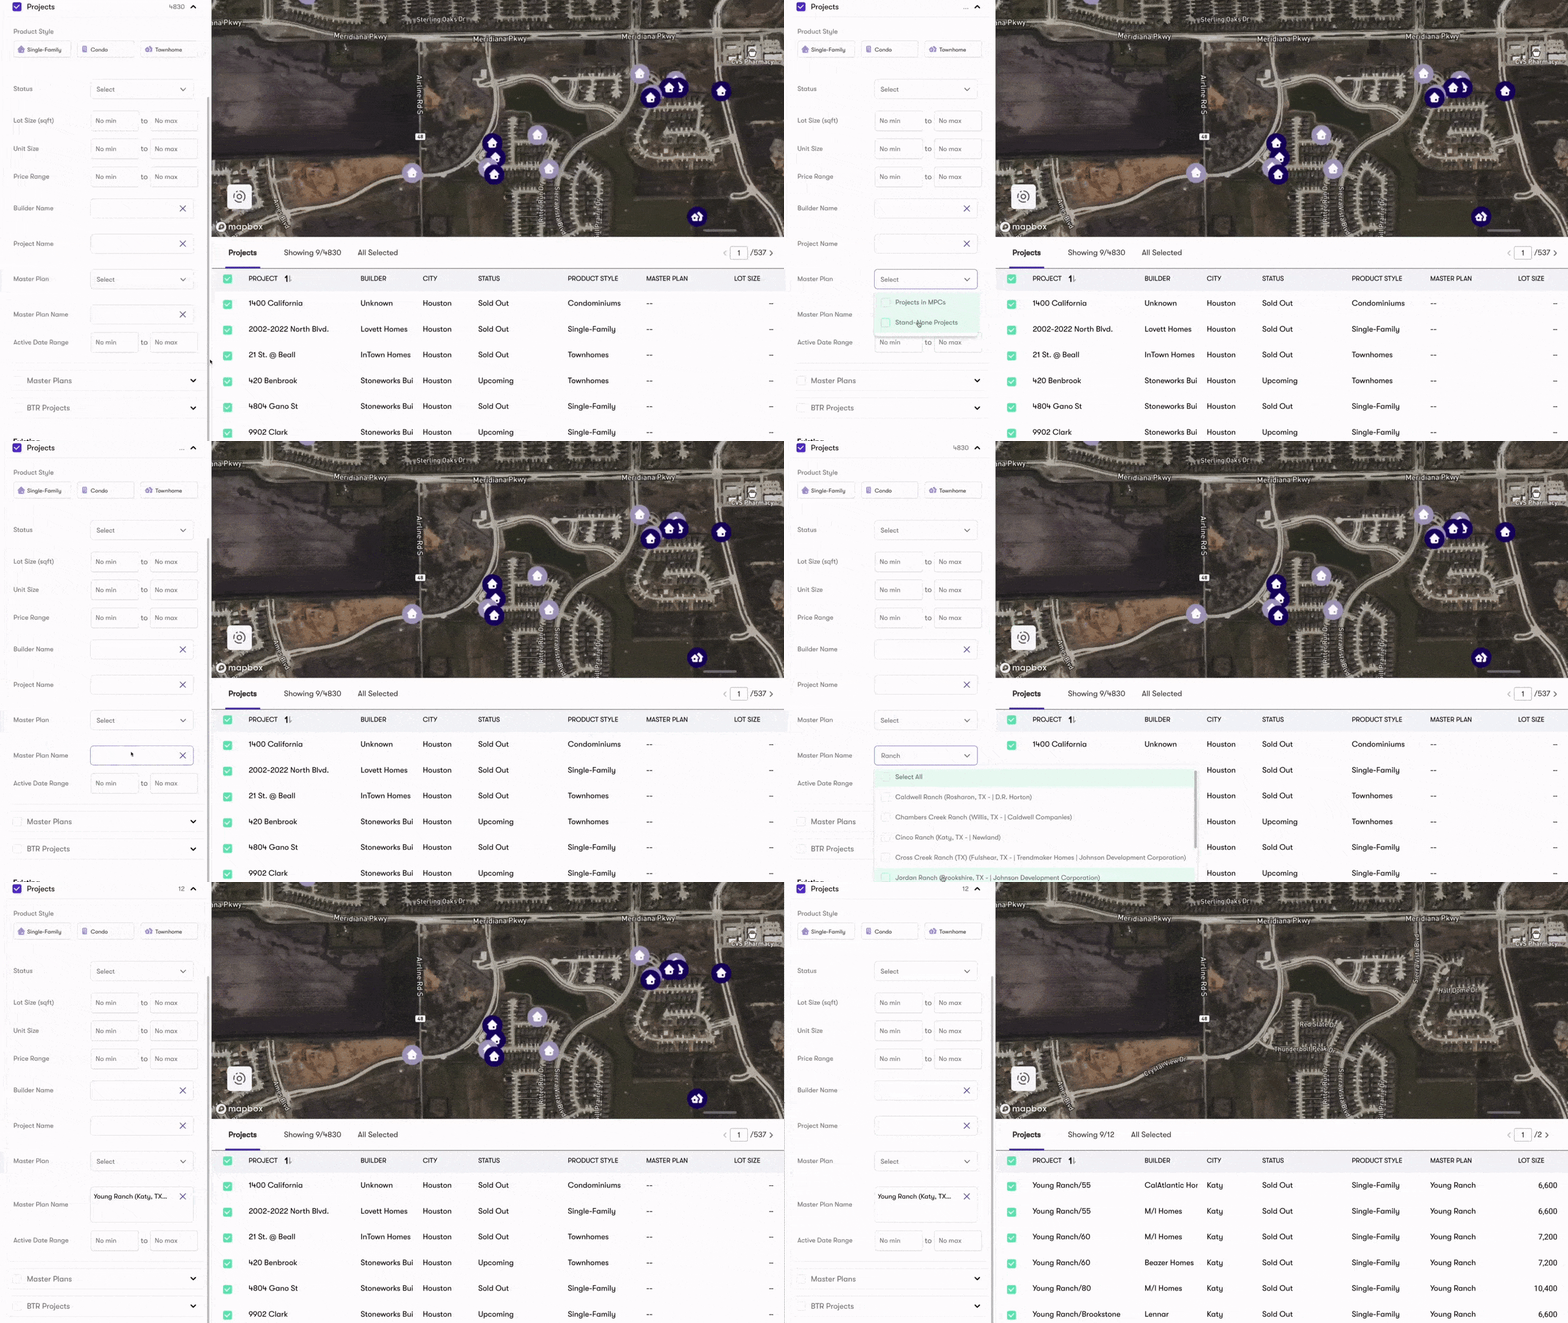
2. New Master Plan Developer and Project Filters

With these new filtering options, you can now identify and analyze master plan communities by developer name or choose specific project types, such as Active Adult communities. Select and view projects within a master plan, standalone projects, or both. Easily gain insights into community segmentation, and pinpoint pricing and performance differences between standalone and master plan projects.
3. Enhanced Map Marker Selection

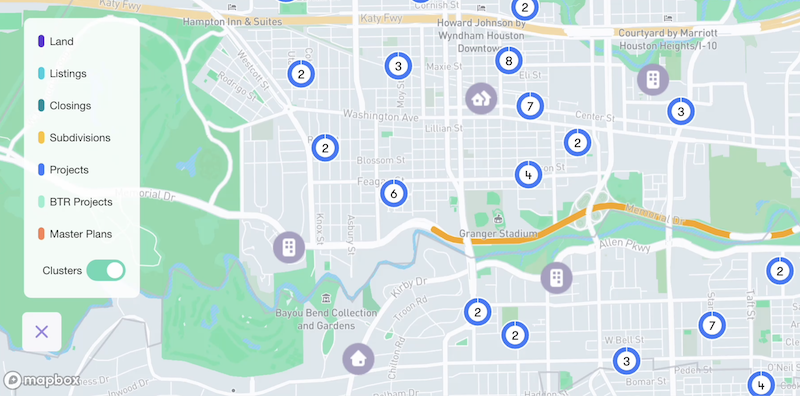
To further simplify data visualization, we’ve added enhancements for toggling between individual markers and clusters. The new vertical cluster legend displays unit counts for closings and listings, helping you zero in on only the specifics you need. Whether you’re visualizing individual projects or analyzing broader clusters, this update provides clearer insights tailored to your preferences.
4. Expanded Exportable Data Sets
Lastly, Enterprise 6.0 expands the range of data available in exports, adding company boundaries to all CSVs and including metrics such as sales volume, lot size, and year-over-year changes. Incorporate more comprehensive details into your analysis, capturing sales volume, lot size, and market share trends directly in your exported data.
Experience the New Features in Enterprise 6.0
Enterprise 6.0 is designed to bring even greater flexibility and depth to your analysis. To explore these new features in action, reach out to your local Customer Success Manager or log in to Enterprise today. Not a Zonda Enterprise Customer? Schedule a demo with a Zonda Team member today.
Schedule Demo